Every walk can be broken into a repeating gait cycle, and a handful of numbers describe it: walking speed, cadence, step and stride length, step time, stance and swing, single and double support, step width and left-right symmetry. This guide explains each gait parameter in plain words, gives typical values for healthy adults and adults over 70 with their sources, shows how they change with age, and says which ones matter most. Short version: at a usual pace, each foot spends about 60% of the cycle on the ground and 40% in the air, and walking speed is the number to read first.
The gait cycle: stance and swing
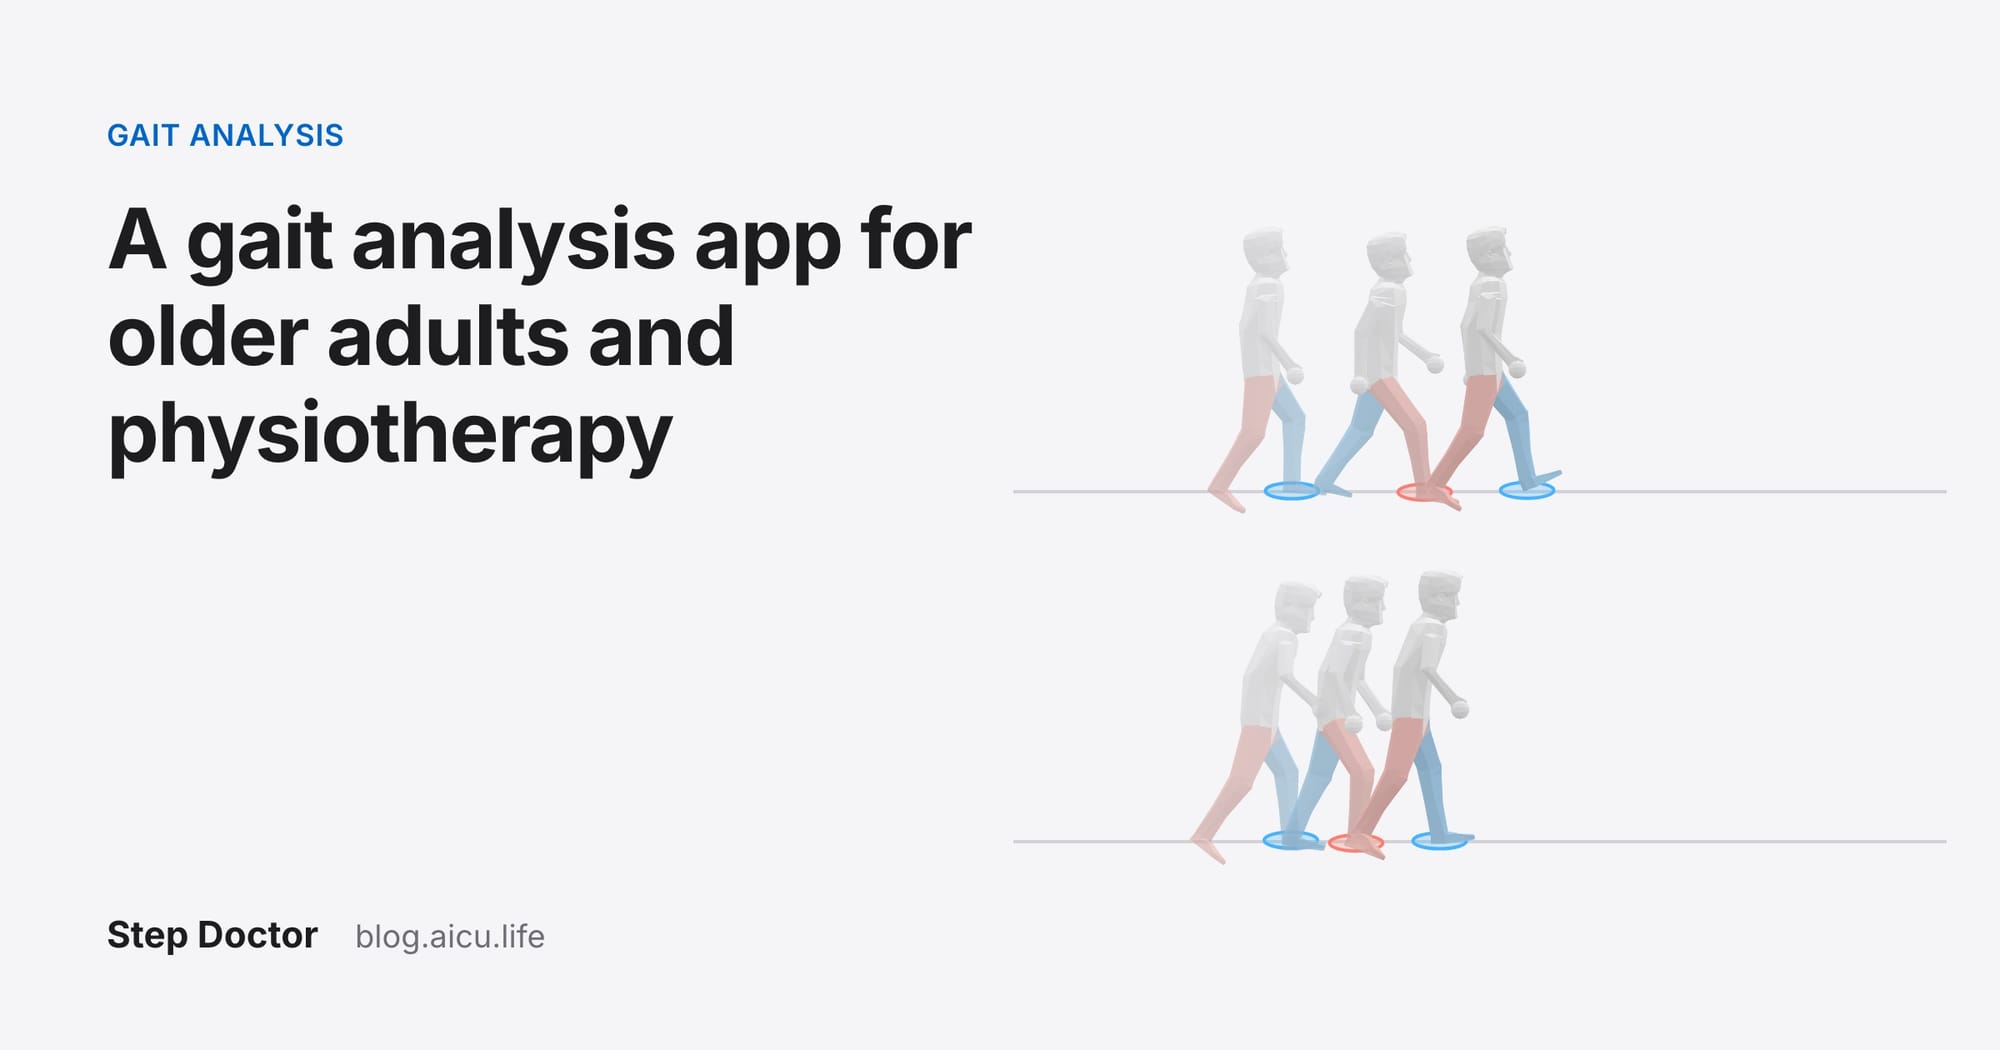
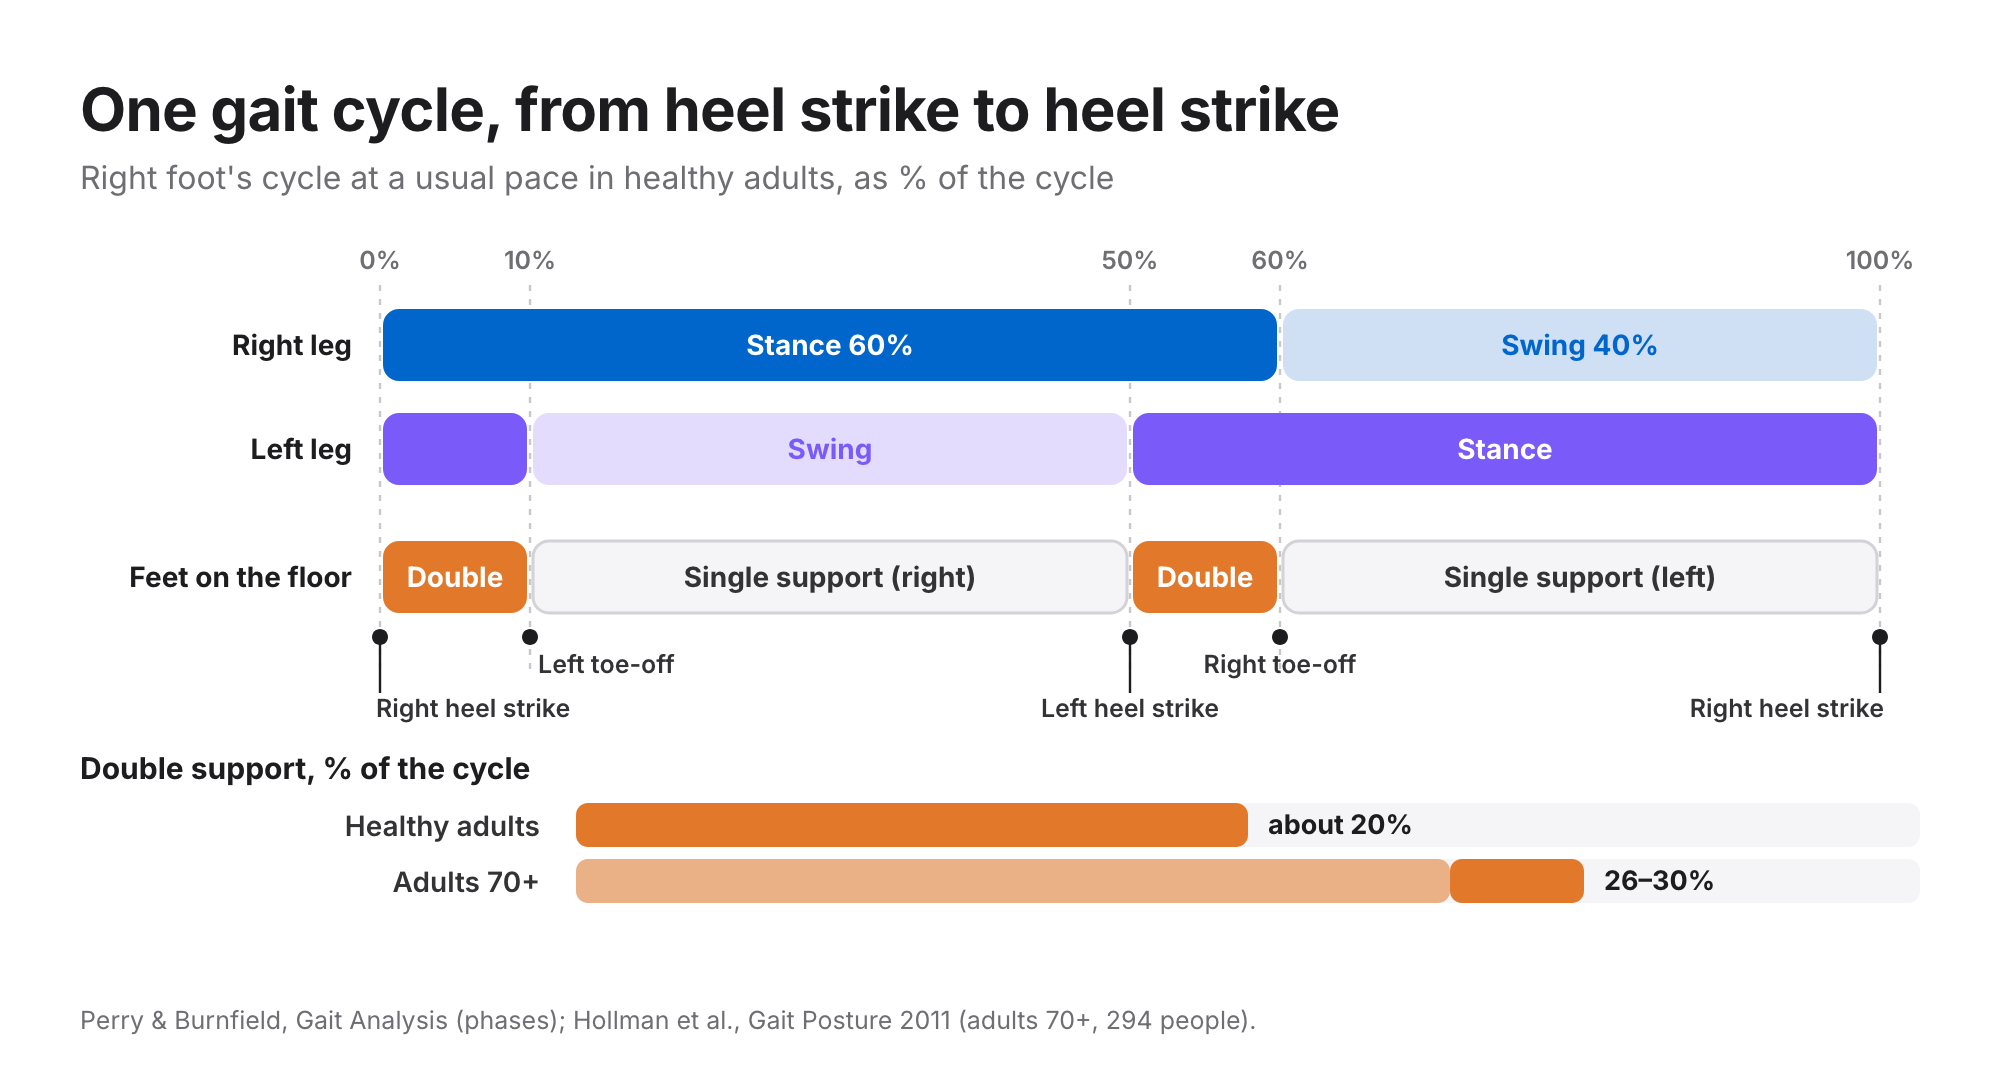
One gait cycle runs from one foot touching the ground (usually the heel) to the same foot touching it again. It has two phases for each leg:
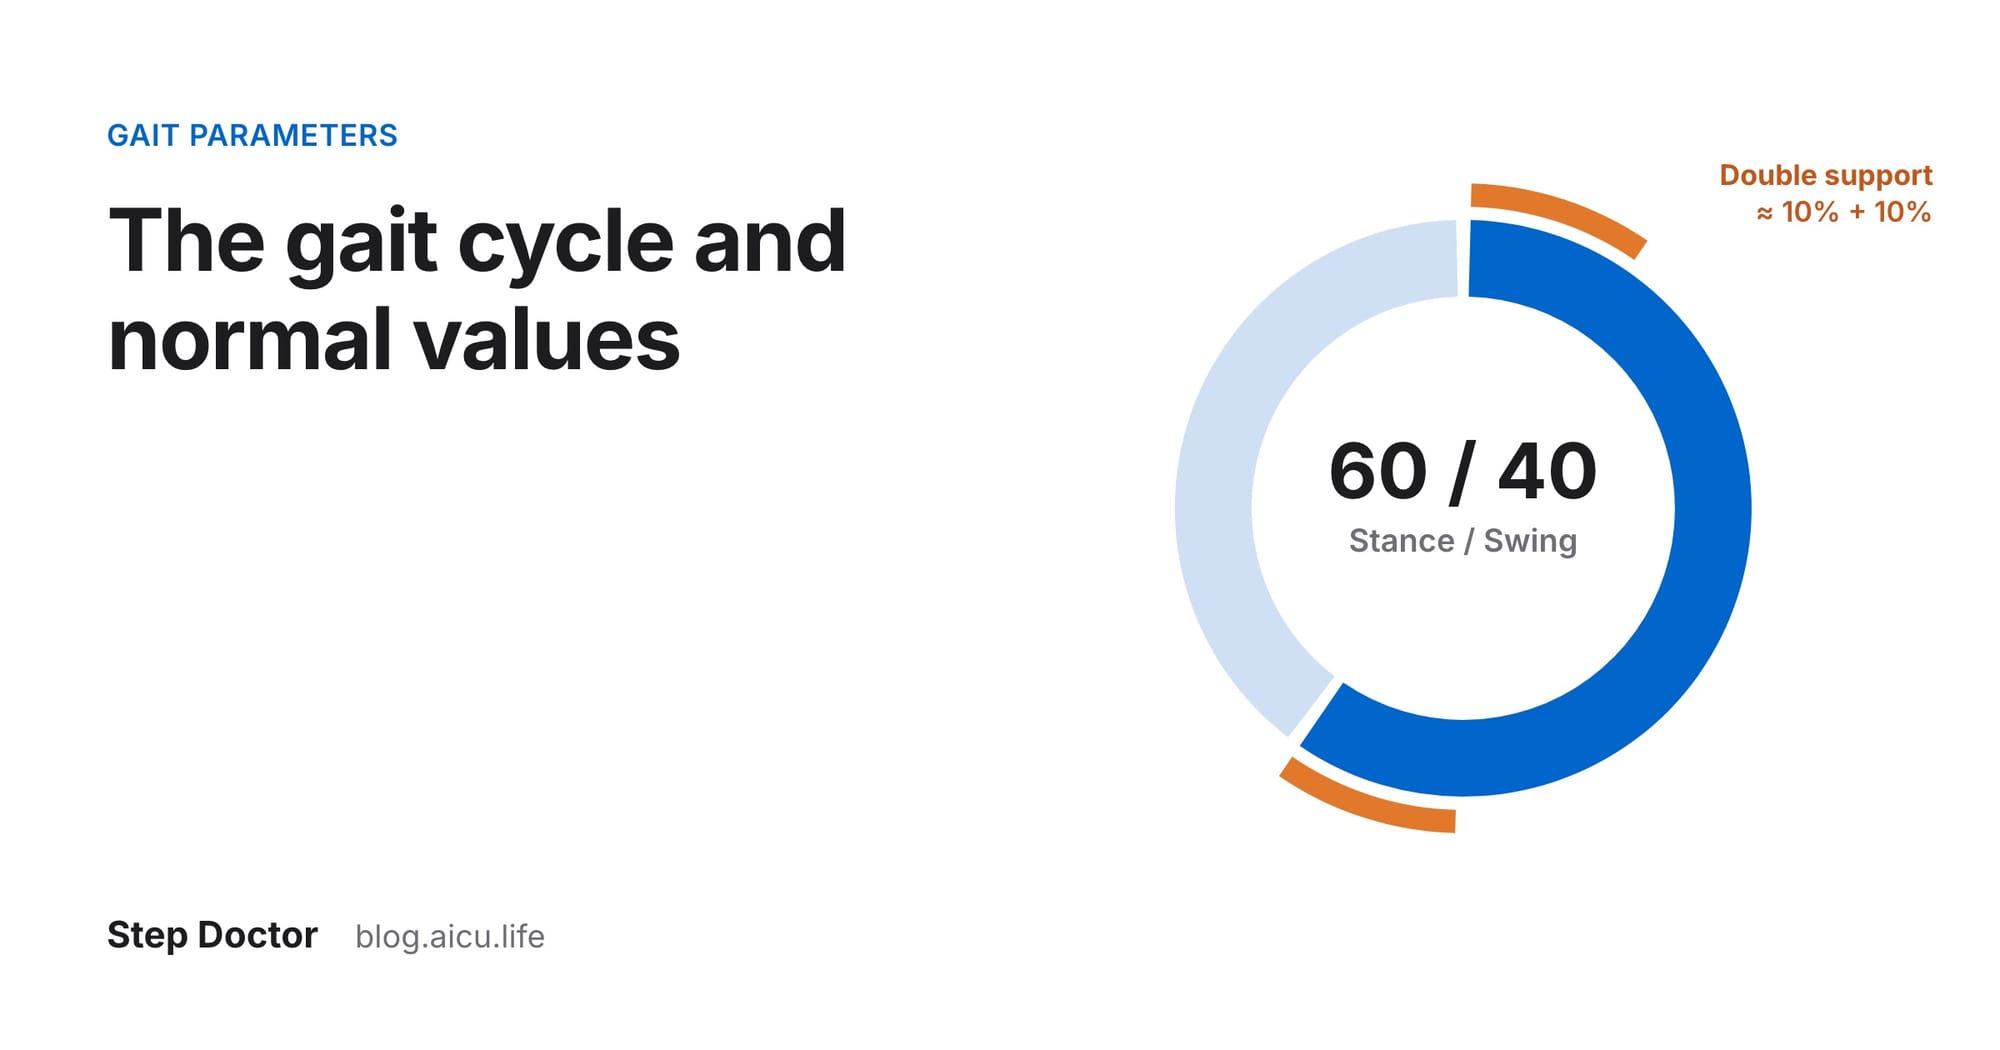
- Stance: the foot is on the ground, carrying weight. At a usual pace it takes about 60% of the cycle.
- Swing: the foot is in the air, moving forward for the next step. It takes the other 40% or so.
That 60/40 split is the classic description of healthy walking (Perry & Burnfield, Gait Analysis: Normal and Pathological Function). It isn't fixed: walking faster shortens stance, walking slower lengthens it. In 294 healthy adults over 70 measured on an electronic walkway, stance averaged 63–65% and swing 35–37% (Hollman et al., 2011).
Single support vs double support
Because each stance phase is longer than half the cycle, the two stance phases overlap. That gives two kinds of support:
- Double support: both feet are on the ground. It happens twice per cycle, just after each heel strike, each time for about 10% of the cycle, so about 20% in total at a usual pace in healthy adults (Perry & Burnfield).
- Single support: only one foot is on the ground while the other swings. Each leg's single support lasts about as long as the other leg's swing, roughly 40% of the cycle.
What more double support means. Time on both feet is the most stable part of walking, so people spend more of it when balance or confidence drops, when they walk slowly, or on slippery ground. Adults over 70 averaged 26–30% double support (Hollman et al., 2011), and fit, healthy older adults already showed more of it than young adults, which the authors read as an adaptation toward a safer gait (Winter et al., 1990). In 597 adults aged 70 and over followed for about 20 months, a longer double-support phase predicted falls, even after accounting for age, illness, cognition and standard balance tests (Verghese et al., 2009). Because double support also rises whenever you walk slower, compare it at the same pace, and read it next to walking speed rather than alone.
Step length vs stride length
These two are easy to mix up, and many apps use them differently:
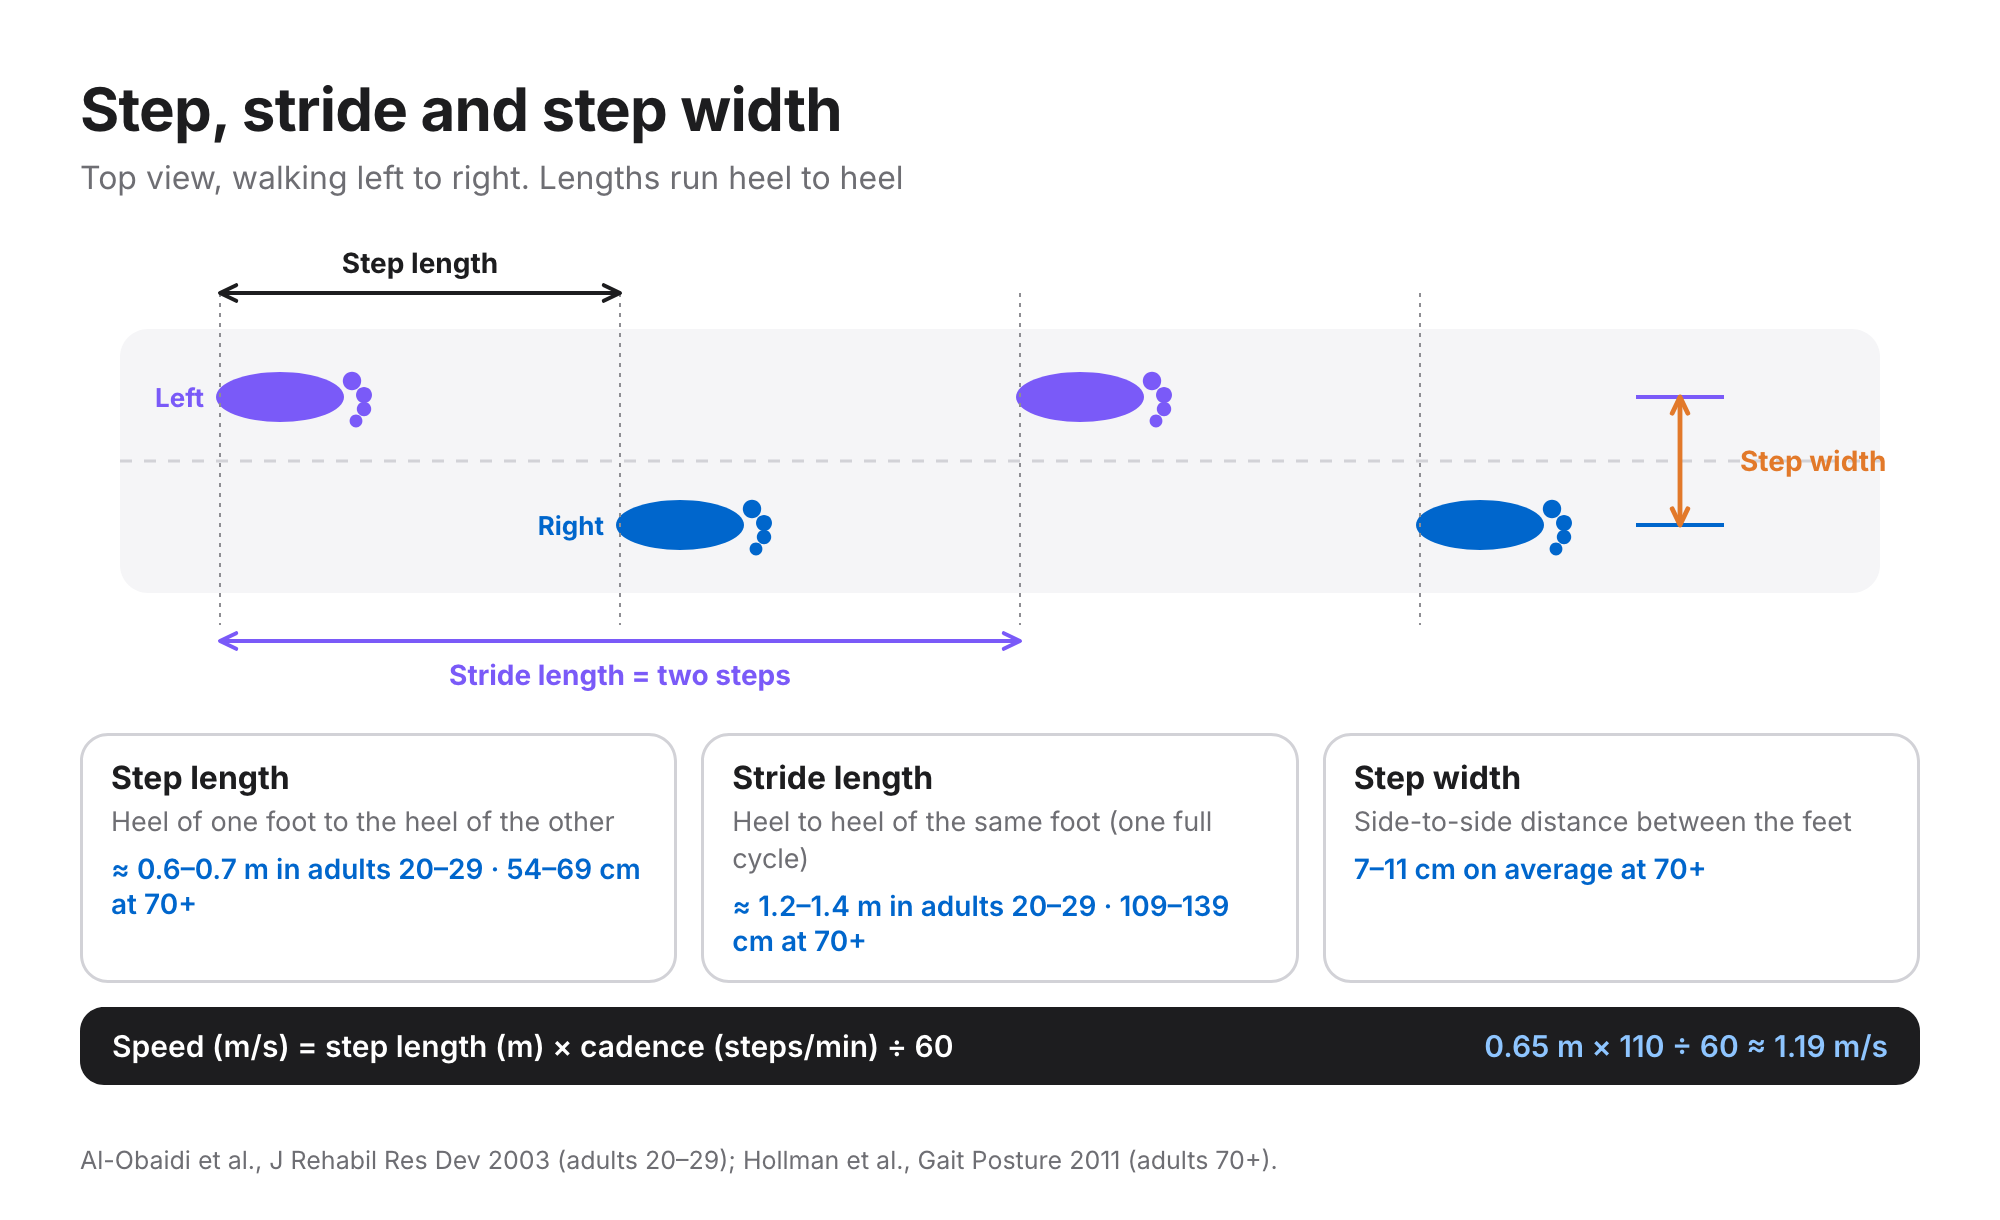
- Step length is the distance from the heel of one foot to the heel of the other foot, measured along the direction of walking. A left step and a right step can differ.
- Stride length is the distance from one heel strike to the next heel strike of the same foot. One stride = two steps = one gait cycle, so stride length is about twice the step length.
In healthy 20–29-year-olds walking at their usual pace, average steps were 0.59–0.70 m in Swedish and Kuwaiti samples of 15 men and 15 women each (Al-Obaidi et al., 2003), which puts stride length at roughly 1.2–1.4 m. Adults over 70 averaged 54–69 cm steps and 109–139 cm strides, depending on sex and age group (Hollman et al., 2011). Taller people take longer steps, so compare yourself with your own earlier results first. When you compare stride-length numbers across walking apps or reports, check which definition each one uses: a "stride" in one app may be a "step" in another.
Cadence (steps per minute)
Cadence is how many steps you take per minute. At a usual pace, the young adult samples above averaged 104–125 steps per minute (Al-Obaidi et al., 2003), and adults over 70 averaged 102–114, with women taking more, shorter steps than men (Hollman et al., 2011). Step time, the time from one foot's contact to the other's, is simply 60 ÷ cadence: 100 steps/min is 0.60 s per step, 120 is 0.50 s. Adults over 70 averaged 0.53–0.59 s.
Cadence is also a handy effort gauge. About 100 steps per minute marks the start of moderate-intensity walking (3 METs) in adults aged 21–40 and 61–85, with 110 and 120 matching about 4 and 5 METs in the older group (Tudor-Locke et al., 2019; Tudor-Locke et al., 2021). Our cadence in brief covers how to count it.
Speed, step length and cadence are tied together: speed (m/s) = step length (m) × cadence ÷ 60. Steps of 0.65 m at 110 steps/min give about 1.19 m/s.
Step width
Step width is the side-to-side distance between the two feet, measured from heel to heel across the line of walking. Adults over 70 averaged 7–11 cm (Hollman et al., 2011). A wider base is a common way to feel steadier, so it often goes with slow, careful walking; very narrow steps can also make balance harder. Like double support, it reads best next to speed and alongside your own earlier results.
Walking speed
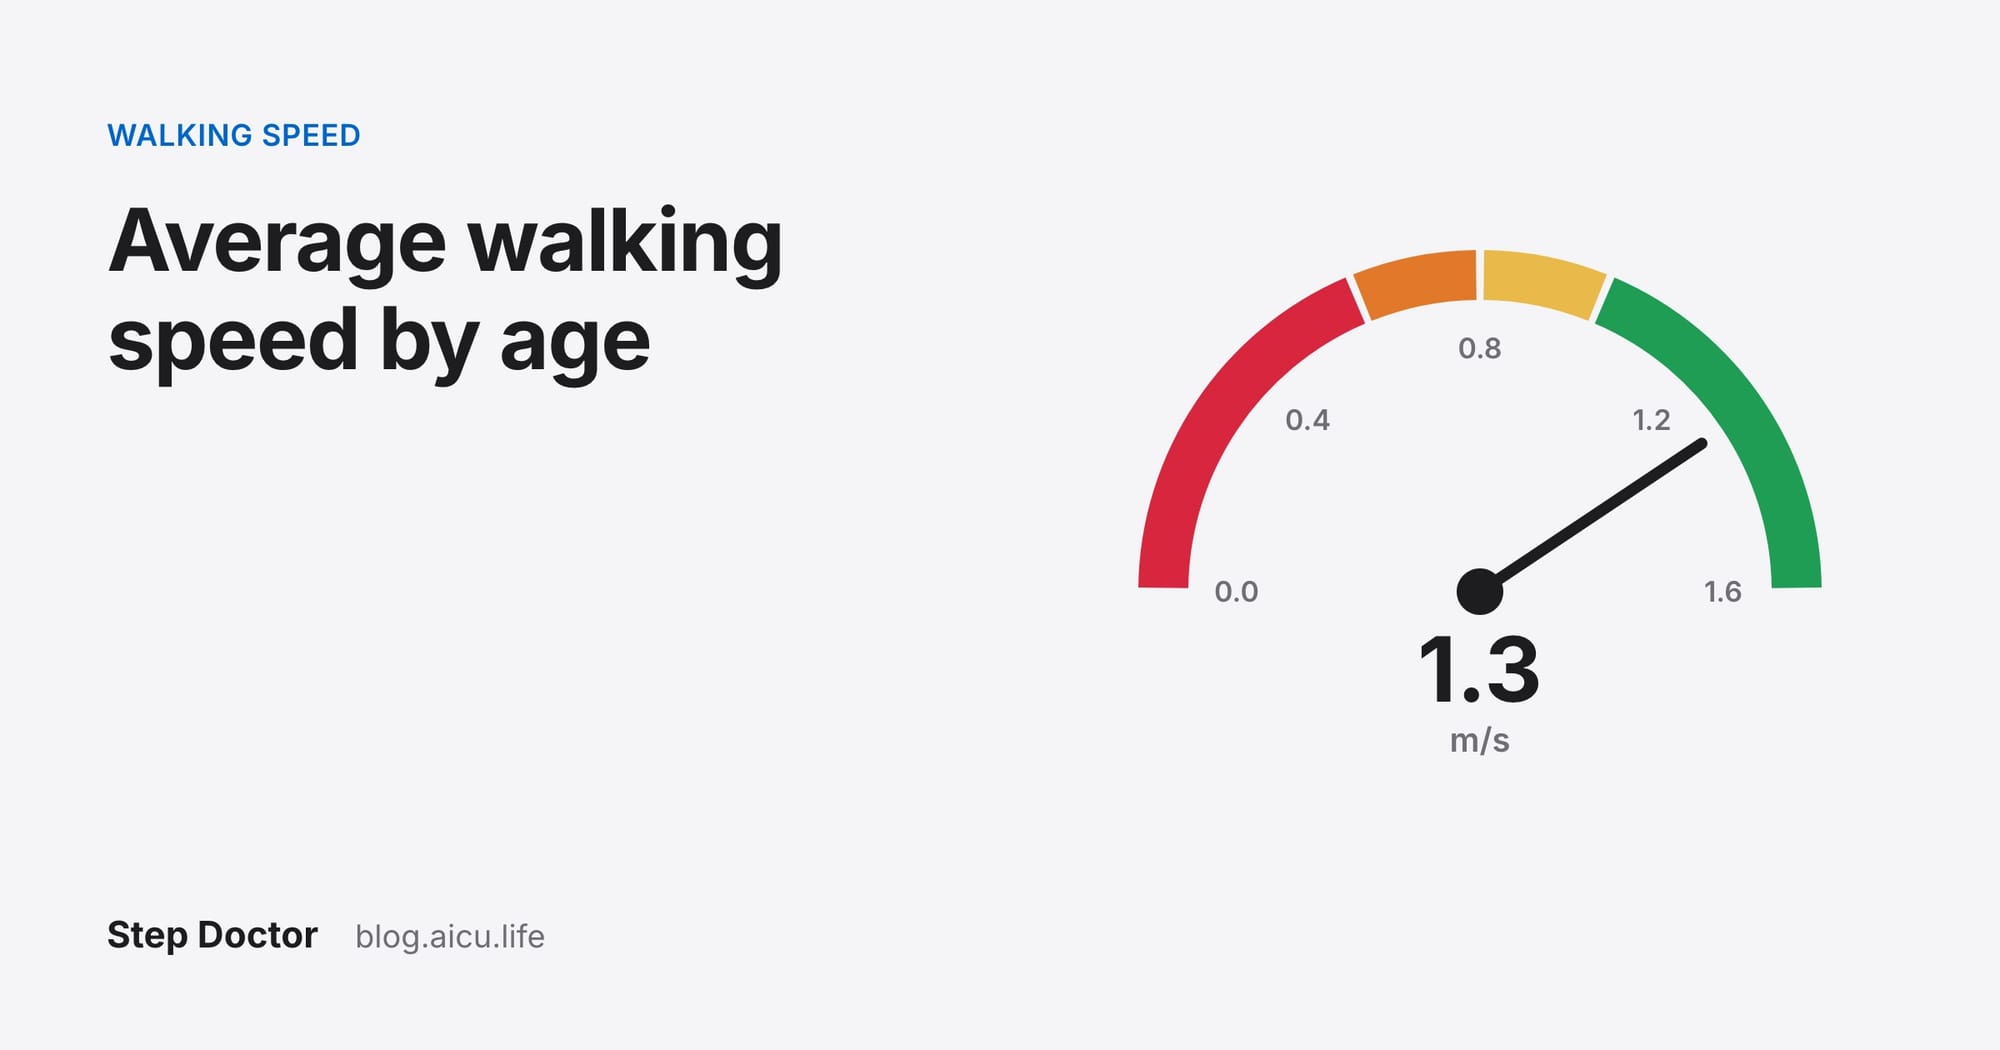
Walking speed sums up all the other parameters in one number. Healthy adults walk at about 1.2–1.4 m/s at their usual pace (Fritz & Lusardi, 2009), with averages by age and sex from a meta-analysis of 23,111 people (Bohannon & Williams Andrews, 2011). In adults over 65, under 0.6 m/s makes poor health and function more likely and 1.0 m/s or more goes with longer than expected survival (Studenski et al., 2011). The full table and cut-offs are in our guide to average walking speed by age.
Left-right symmetry
Symmetry compares the two sides: left vs right step length, swing time and stance time. A common way to express it is the symmetry ratio, the larger side divided by the smaller, so 1.0 means perfectly even. A comparison of methods in 161 people after stroke and 81 healthy adults recommended exactly that: the symmetry ratio, using step length, swing time and stance time (Patterson et al., 2010).
Healthy walking is close to even, though rarely perfectly so. Clear asymmetry is common after a stroke, a leg injury or an operation, or with joint pain. Small differences in a single walk are often noise, so look for the same side coming out shorter or slower across several recordings before reading much into it.
Normal values: a table of typical gait parameters
Typical values at a usual, comfortable pace. Ranges show averages across the groups studied (by sex and age), not the limits of normal for one person.
| Parameter | Healthy adults | Adults 70+ |
|---|---|---|
| Walking speed | 1.2–1.4 m/s (Fritz & Lusardi, 2009) | 0.98–1.22 m/s |
| Cadence | 104–125 steps/min (ages 20–29) | 102–114 steps/min |
| Step length | 0.59–0.70 m (ages 20–29) | 54–69 cm |
| Stride length | about 1.2–1.4 m (two steps) | 109–139 cm |
| Step time | about 0.48–0.58 s (60 ÷ cadence) | 0.53–0.59 s |
| Stance / swing | about 60% / 40% (Perry & Burnfield) | 63–65% / 35–37% |
| Double support | about 20% of the cycle | 26–30% |
| Step width | – | 7–11 cm |
| Left-right symmetry | ratio close to 1.0 | ratio close to 1.0 |
Sources: adults 70+ from Hollman et al., 2011 (294 people, GAITRite walkway, means by sex and five-year age group). Cadence and step length for ages 20–29 from Al-Obaidi et al., 2003 (two small samples); stride length and step time in that column are derived from them. The walking speed and other test cut-offs are also on our reference values page.
How gait parameters change with age
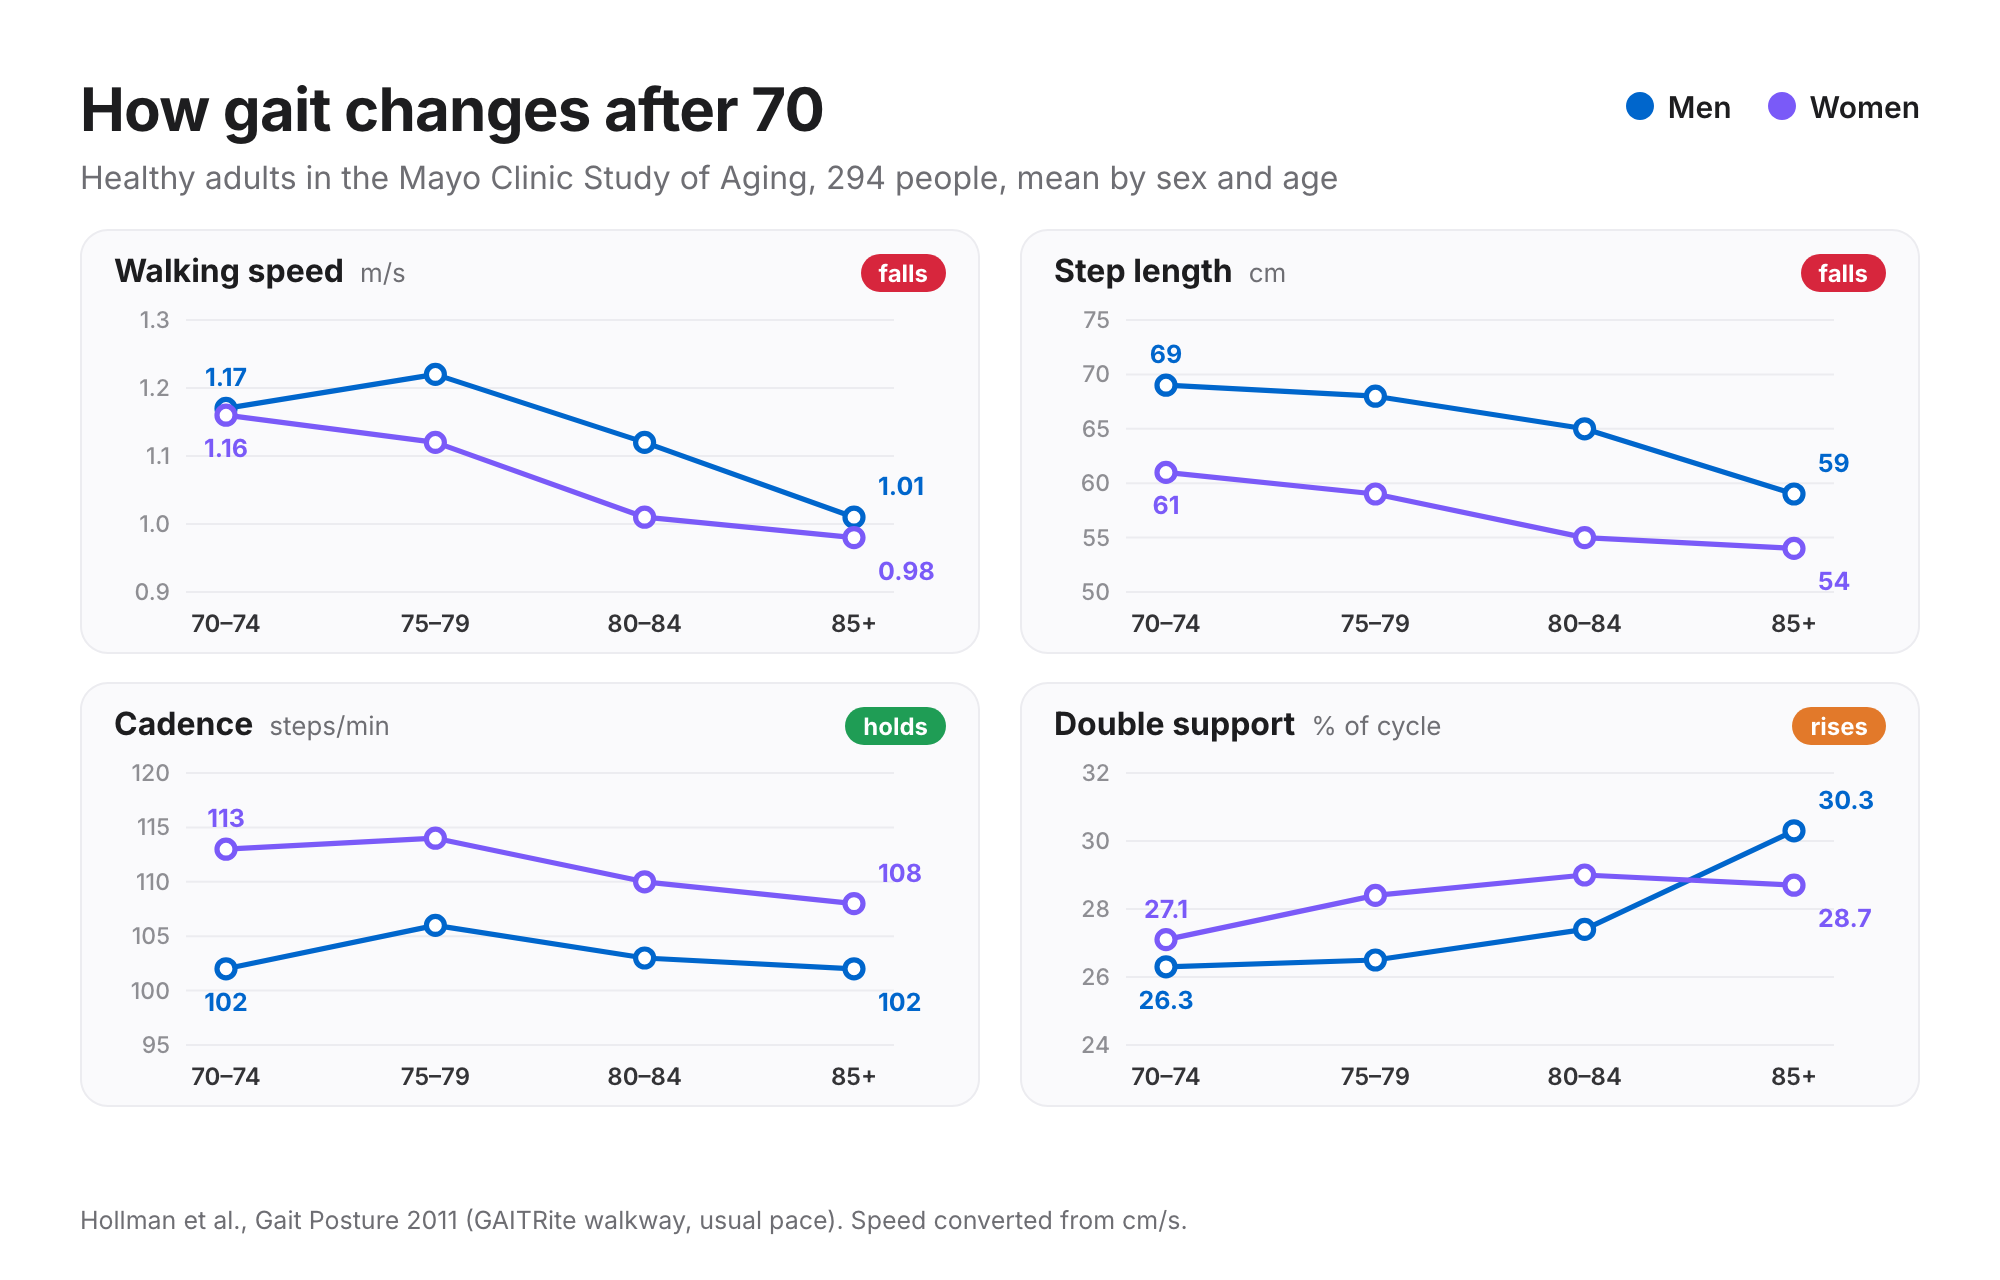
Through most of adult life, gait is fairly stable. A study of 545 healthy Swiss adults aged 20 to over 90 found that speed and stride length fell and the variability of the gait cycle and asymmetry rose with age, with the clearest drop in people aged 80 and over (Rössler et al., 2024). The pattern is consistent: steps get shorter while cadence holds, so speed falls, and more of the cycle is spent on both feet. Fit older adults already walked with the same cadence but shorter steps and more double support than young adults (Winter et al., 1990), and in the Mayo Clinic data, step length and speed fell from the early seventies to 85+ while cadence barely moved (Hollman et al., 2011).
Which gait parameters matter most?
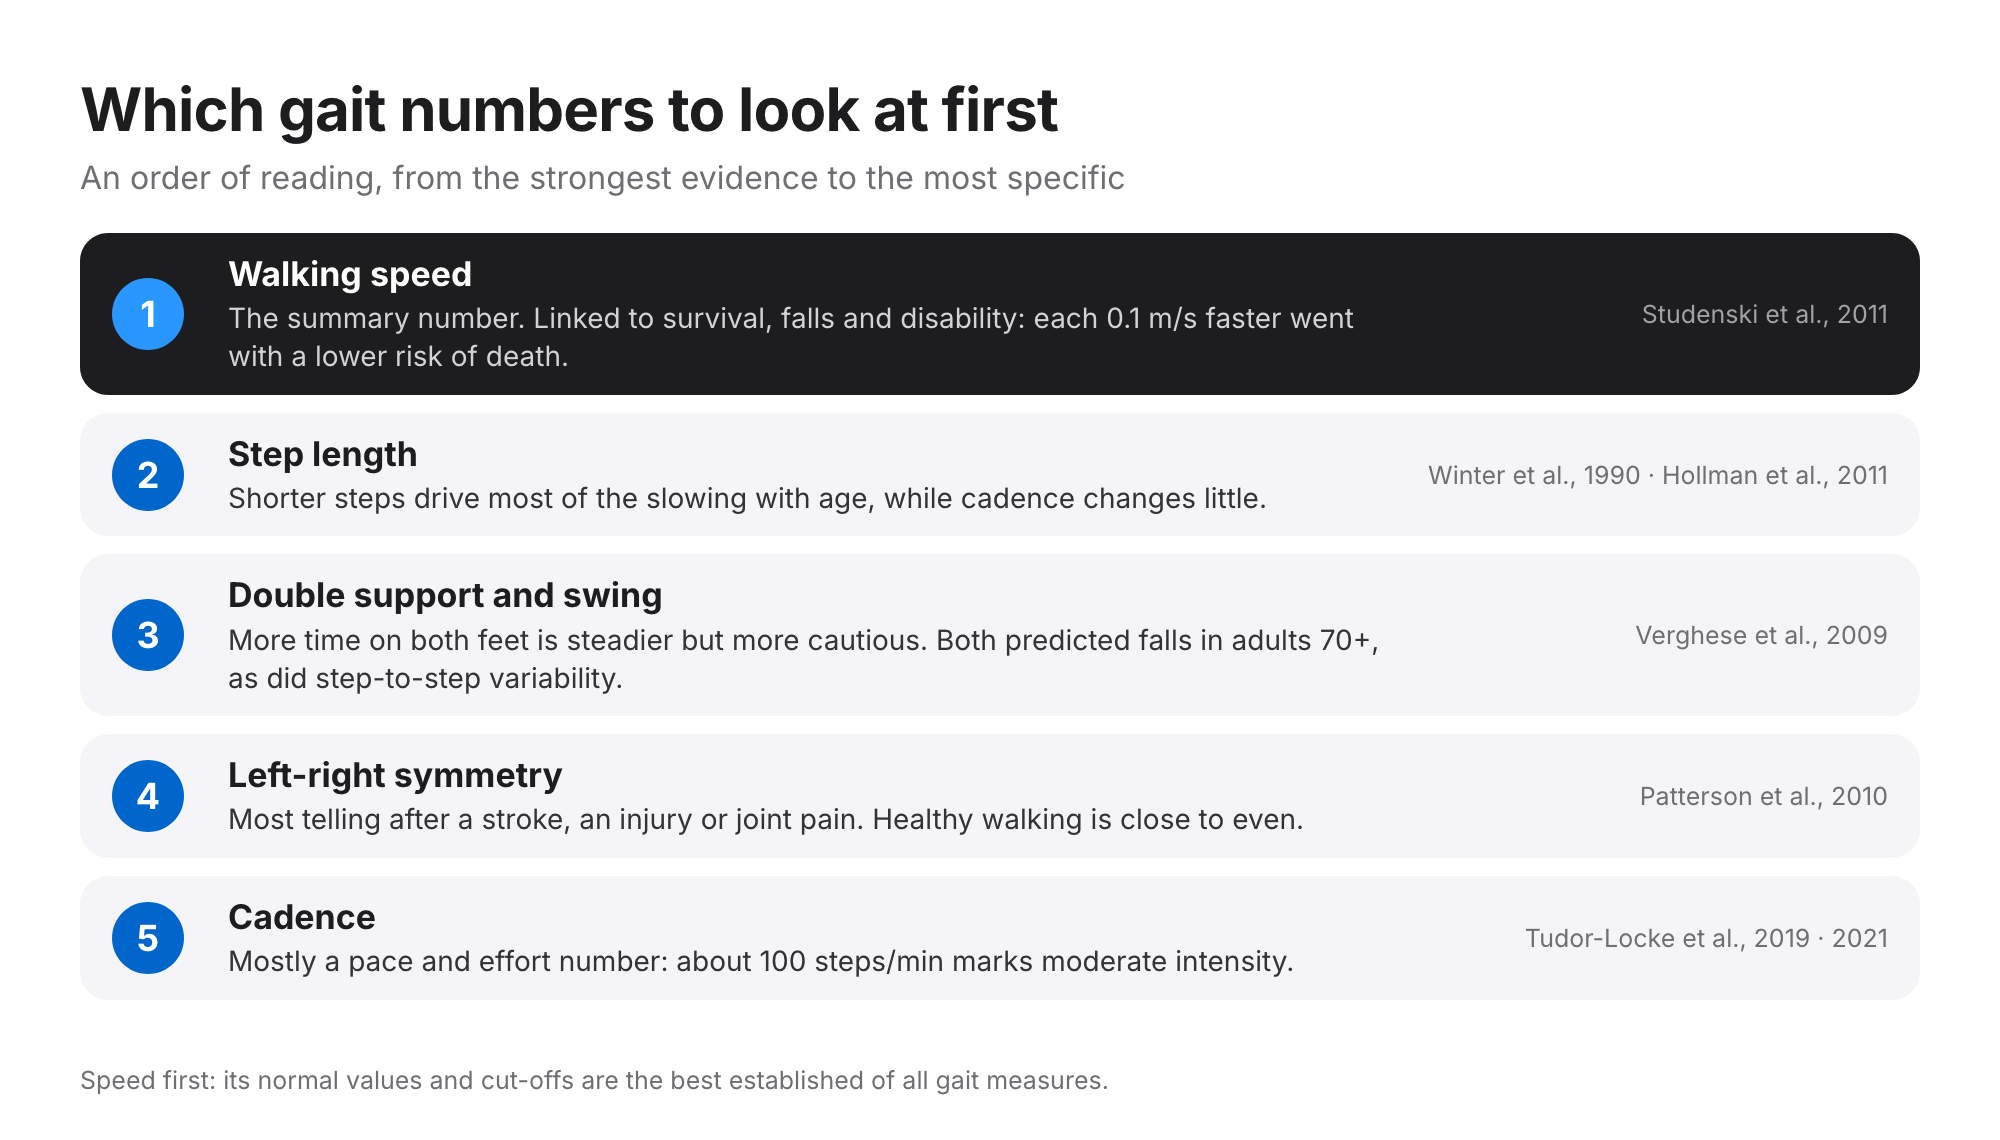
- Walking speed first. It has the best-established norms and cut-offs and the strongest links to survival, falls and disability: each 0.1 m/s faster went with a lower risk of death (Studenski et al., 2011). A review calls it the functional vital sign (Middleton et al., 2015).
- Step length explains most of the change in speed with age, while cadence changes little.
- Double support, swing and variability add information about stability: they predicted falls in adults over 70 independently of other risk factors (Verghese et al., 2009).
- Symmetry matters most when one side is affected: after a stroke, an injury, a joint replacement or with pain.
- Cadence is most useful as a pace and effort measure, and to see whether a change in speed comes from longer steps or quicker ones.
For tracking, the trend beats a single walk. Record the same way each time (same course, shoes and pace) and compare like with like. In older adults, a speed change of about 0.05 m/s is small but meaningful and about 0.1 m/s is substantial (Perera et al., 2006). For ways to record a walk yourself, see how to do a gait analysis at home, and for what phone measurements can and can't match, is phone gait analysis accurate? and how markerless gait analysis works.
Questions
What is the gait cycle? The sequence from one heel strike to the next heel strike of the same foot. Each leg spends about 60% of it in stance (on the ground) and 40% in swing at a usual pace, with two short periods of double support when both feet are down.
What is a normal double support time? About 20% of the gait cycle in healthy adults at a usual pace, in two periods of about 10% each. Adults over 70 averaged 26–30% (Hollman et al., 2011). More double support goes with slower, more cautious walking and predicted falls in older adults.
What is the difference between step length and stride length? A step is heel to heel of opposite feet; a stride is heel to heel of the same foot, so it equals two steps. Healthy young adults take steps of about 0.6–0.7 m (strides about 1.2–1.4 m); adults over 70 averaged 54–69 cm steps.
What is a normal cadence? Roughly 100–125 steps per minute at a usual pace in healthy adults; adults over 70 averaged 102–114. About 100 steps per minute marks moderate-intensity walking.
Which gait parameter is most important? Walking speed. It has the best-established normal values and cut-offs and the strongest links to health in older adults. Step length, double support and symmetry help explain why speed is low.
Step Doctor measures walking speed, cadence, step length and left-right balance from a phone video, so you can repeat the same walk over time and see how these numbers change. Read more about gait analysis in Step Doctor, or get it on the App Store or Google Play.
Step Doctor supports screening and monitoring. It doesn't diagnose, and results should inform, not replace, the judgement of a healthcare professional.