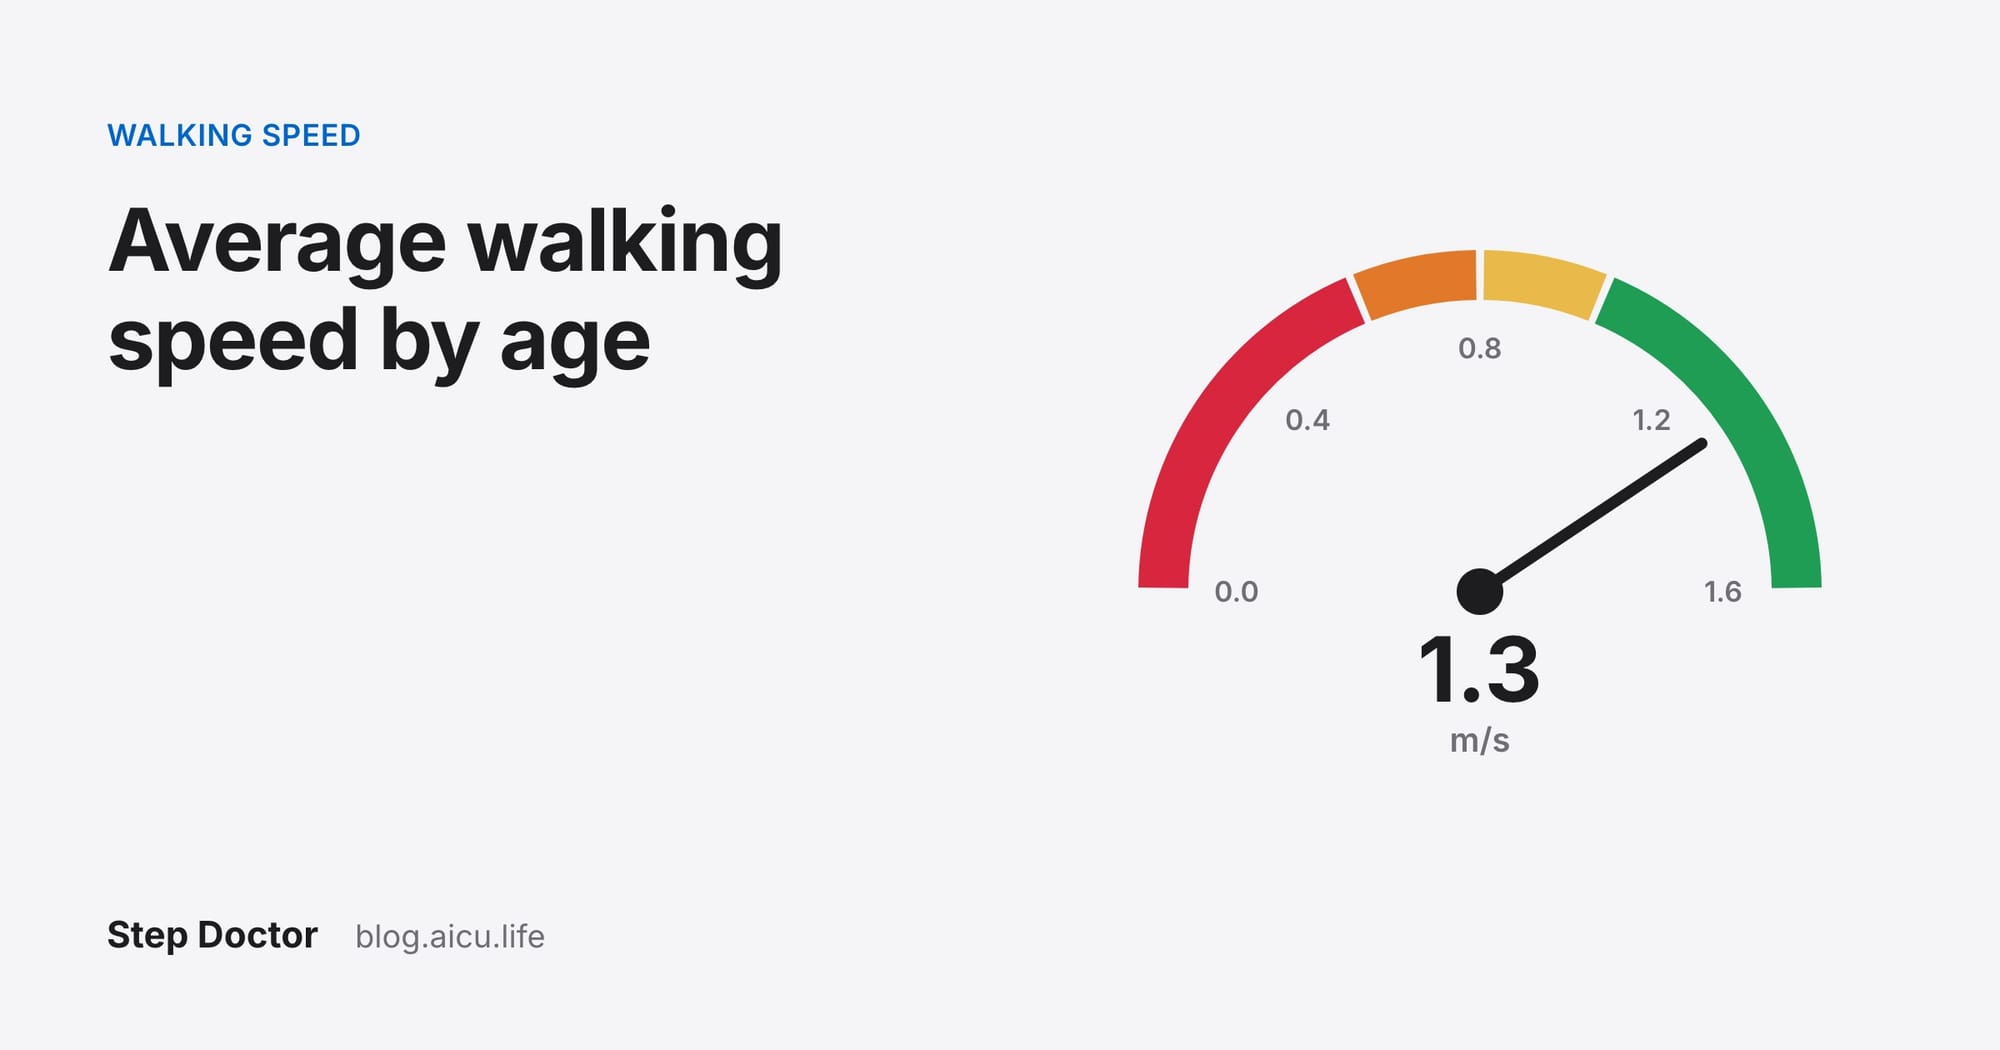
The average adult walks at about 1.2–1.4 metres per second at their usual pace: roughly 4.3–5.0 km/h, or 2.7–3.1 mph (Fritz & Lusardi, 2009). That pace holds steady through middle age, starts to fall in the sixties and drops faster after 80. Walking speed is also one of the best single measures of health in older adults, which is why clinicians call it the "sixth vital sign". This guide gives the averages by age and sex, what counts as slow, and how to measure your own speed at home.
Average walking speed by age and sex
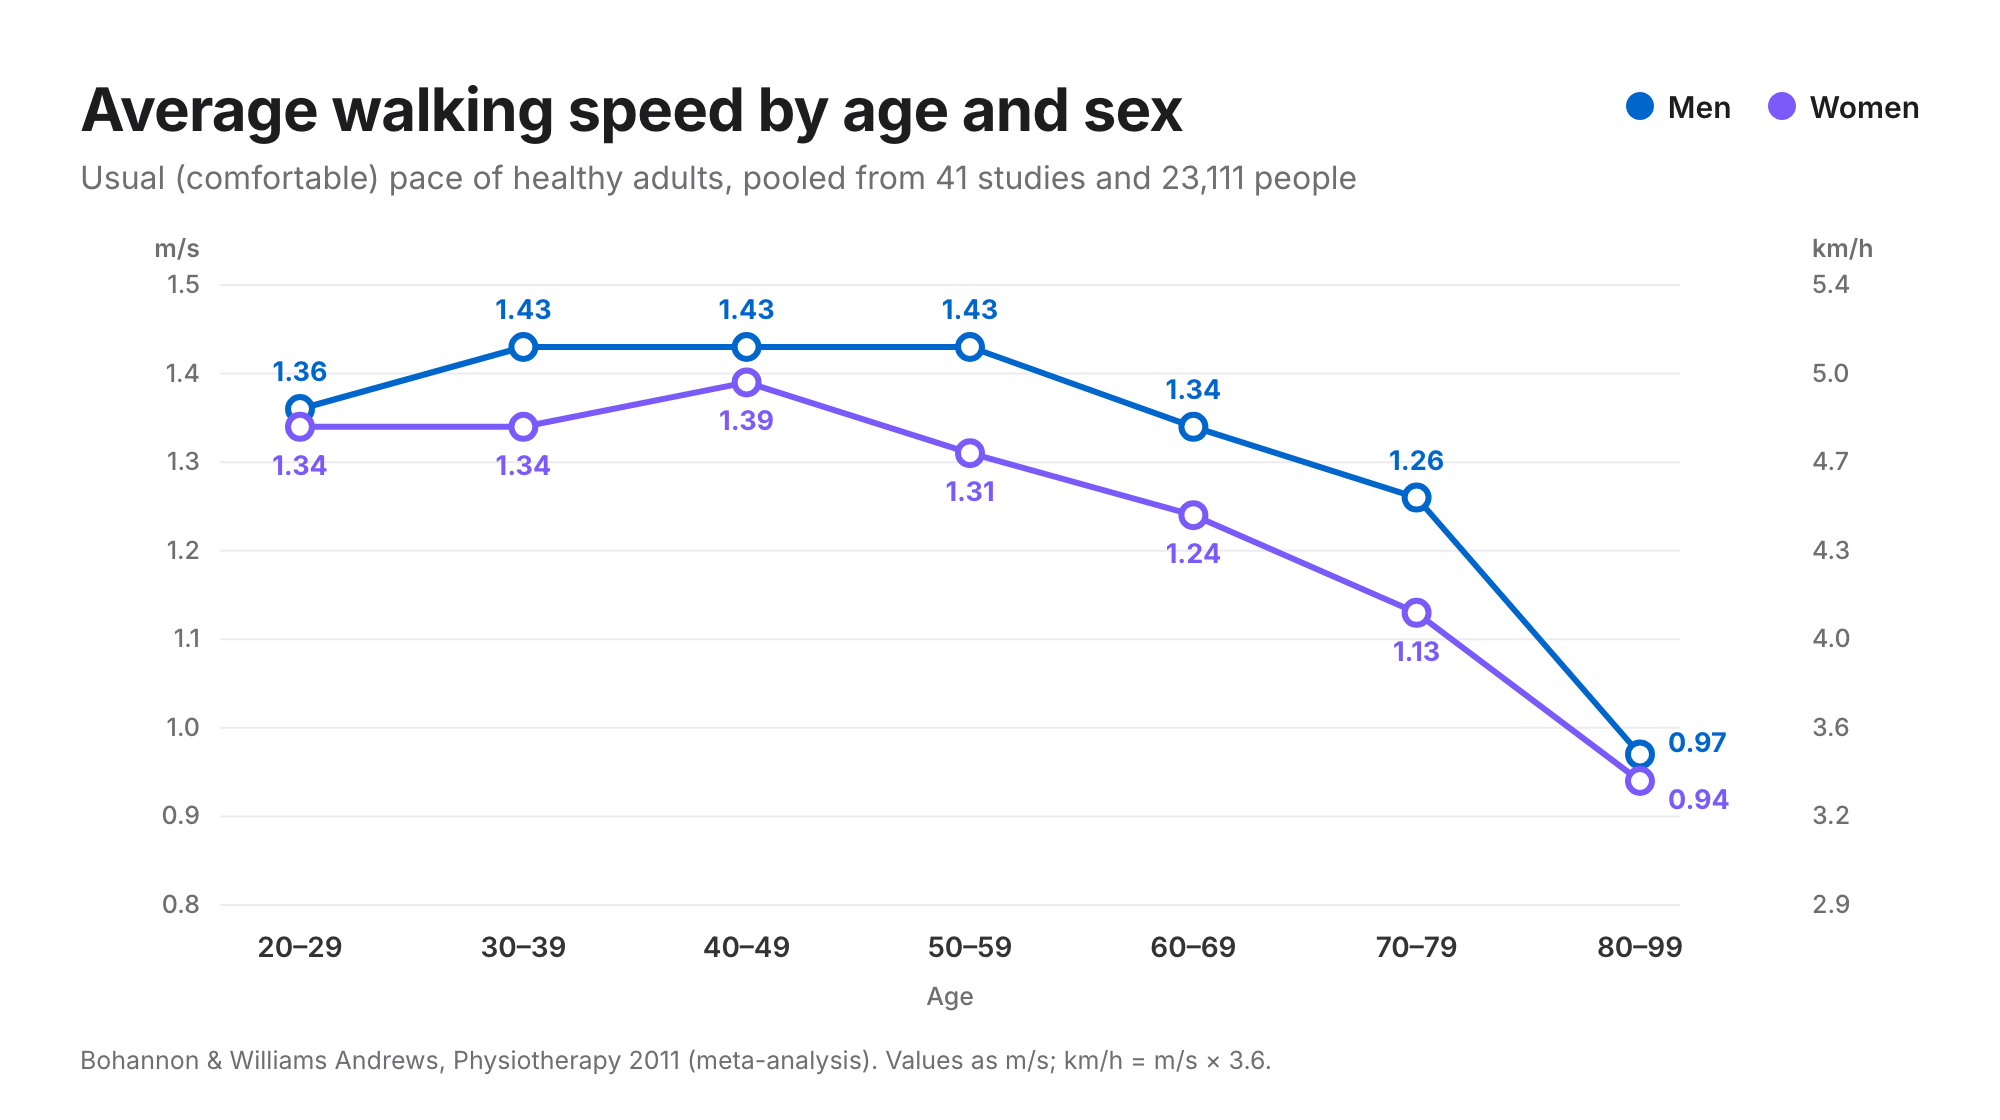
The most-used reference values come from a meta-analysis of 41 studies and 23,111 healthy adults walking at a normal pace over 3 to 30 metres (Bohannon & Williams Andrews, 2011). Here are its averages, with the same values in km/h and mph:
| Age | Men (m/s) | Men (km/h · mph) | Women (m/s) | Women (km/h · mph) |
|---|---|---|---|---|
| 20–29 | 1.36 | 4.9 · 3.0 | 1.34 | 4.8 · 3.0 |
| 30–39 | 1.43 | 5.1 · 3.2 | 1.34 | 4.8 · 3.0 |
| 40–49 | 1.43 | 5.1 · 3.2 | 1.39 | 5.0 · 3.1 |
| 50–59 | 1.43 | 5.1 · 3.2 | 1.31 | 4.7 · 2.9 |
| 60–69 | 1.34 | 4.8 · 3.0 | 1.24 | 4.5 · 2.8 |
| 70–79 | 1.26 | 4.5 · 2.8 | 1.13 | 4.1 · 2.5 |
| 80–99 | 0.97 | 3.5 · 2.2 | 0.94 | 3.4 · 2.1 |
Two things to keep in mind. These are averages of healthy volunteers, so plenty of healthy people walk a little slower or faster. And the authors warn that they may not apply to very short walks started from a standstill on the command "go", or to walks that include a turn: both make the number lower. The same values are on our reference values page, next to the cut-offs for other tests.
What counts as slow?
For adults aged 65 and over, the biggest study is a pooled analysis of nine cohorts and 34,485 people followed for 6 to 21 years (Studenski et al., 2011). Survival rose steadily with walking speed: every 0.1 m/s faster went with a lower risk of death (hazard ratio 0.88). Three numbers help read a result:
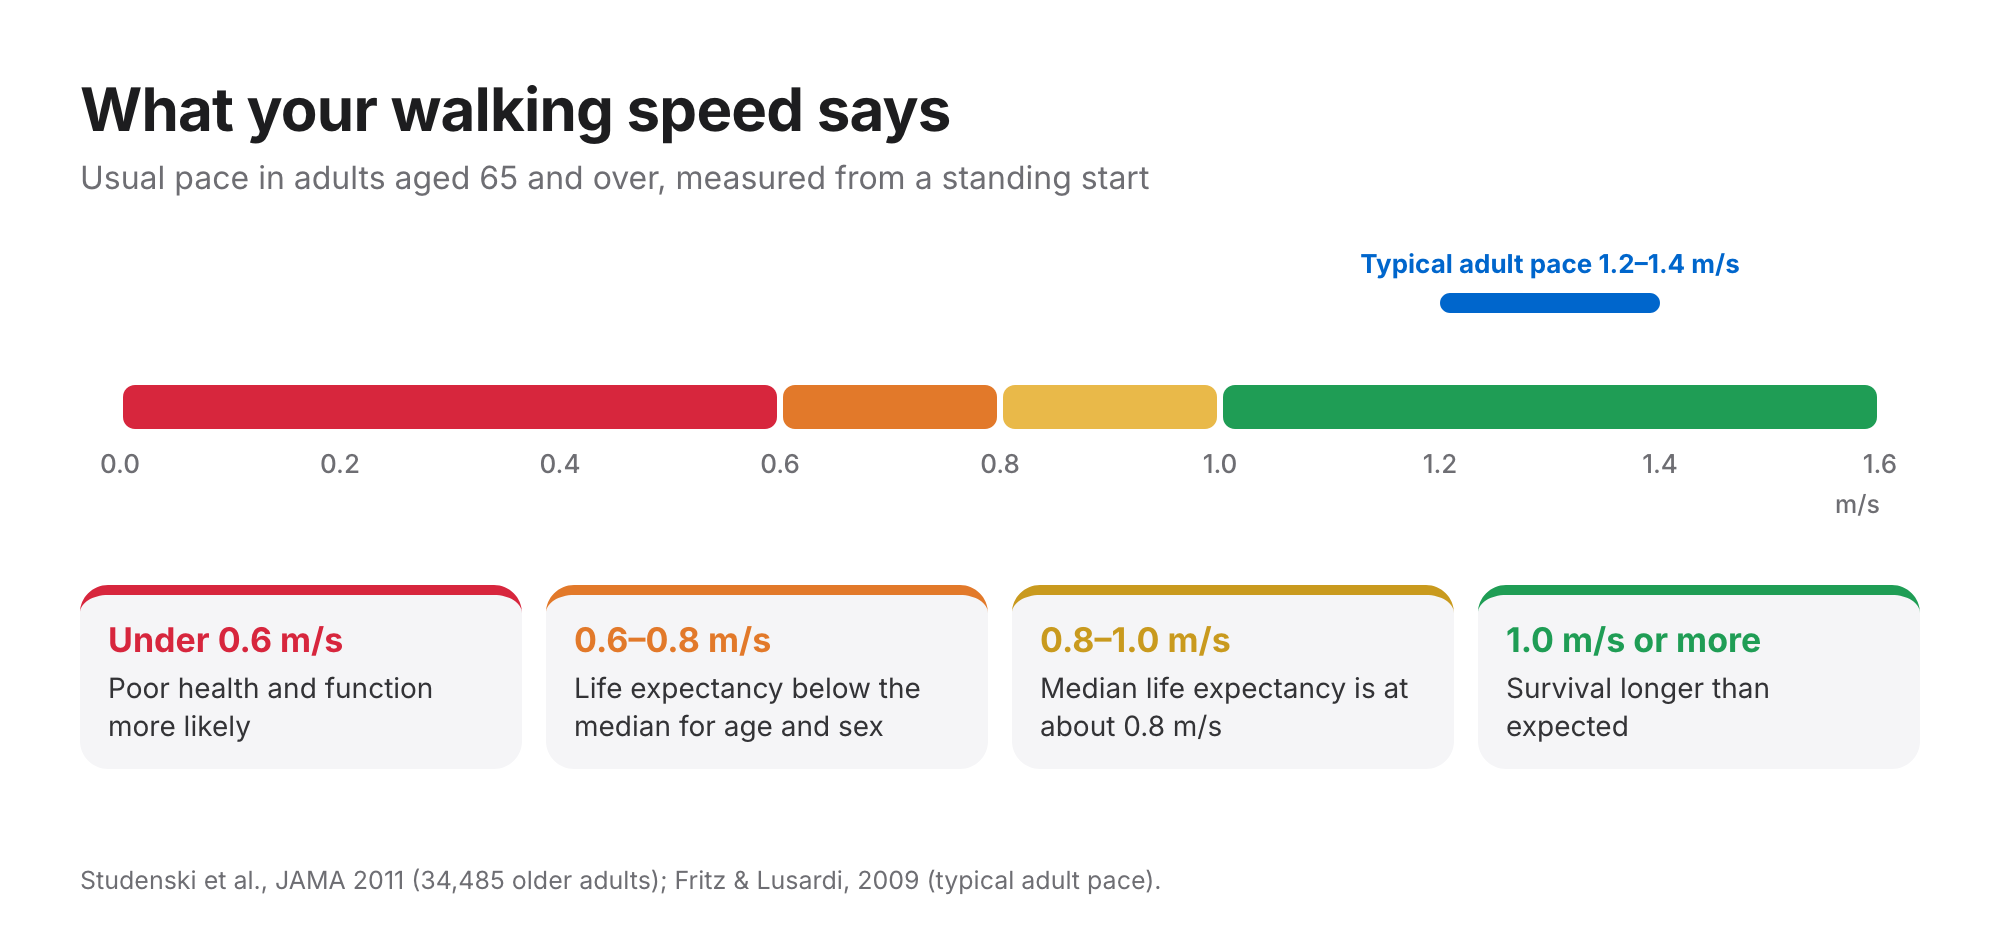
- Under 0.6 m/s: poor health and function are more likely. The authors suggest this group deserves a closer look at the heart and lungs, nerves, and muscles and joints.
- About 0.8 m/s: life expectancy is close to the median for the person's age and sex. Slower means below the median, faster means above.
- 1.0 m/s or more: survival was consistently longer than expected for age and sex.
Sarcopenia guidelines use similar lines for low physical performance: 0.8 m/s or less in the European definition (Cruz-Jentoft et al., 2019) and under 1.0 m/s over 6 metres in the Asian one (Chen et al., 2020). Our sarcopenia self-check covers the other tests in that pathway, and the fall-risk self-check pairs walking speed with the Timed Up and Go.
Why it's called the sixth vital sign
Pulse, blood pressure, breathing rate, temperature and pain are the usual five. In 2009 two physical therapists argued that walking speed belongs next to them (Fritz & Lusardi, 2009): it takes a minute, needs no equipment and reflects many body systems at once. A later review collected the evidence since then and found it still holds up, with slow walking linked to falls, hospital stays, moving into care, cognitive decline and death (Middleton et al., 2015). Like blood pressure, one reading means less than the trend.
How to measure your walking speed at home
You need a tape measure, two pieces of tape on the floor, a stopwatch and ideally someone to time you.
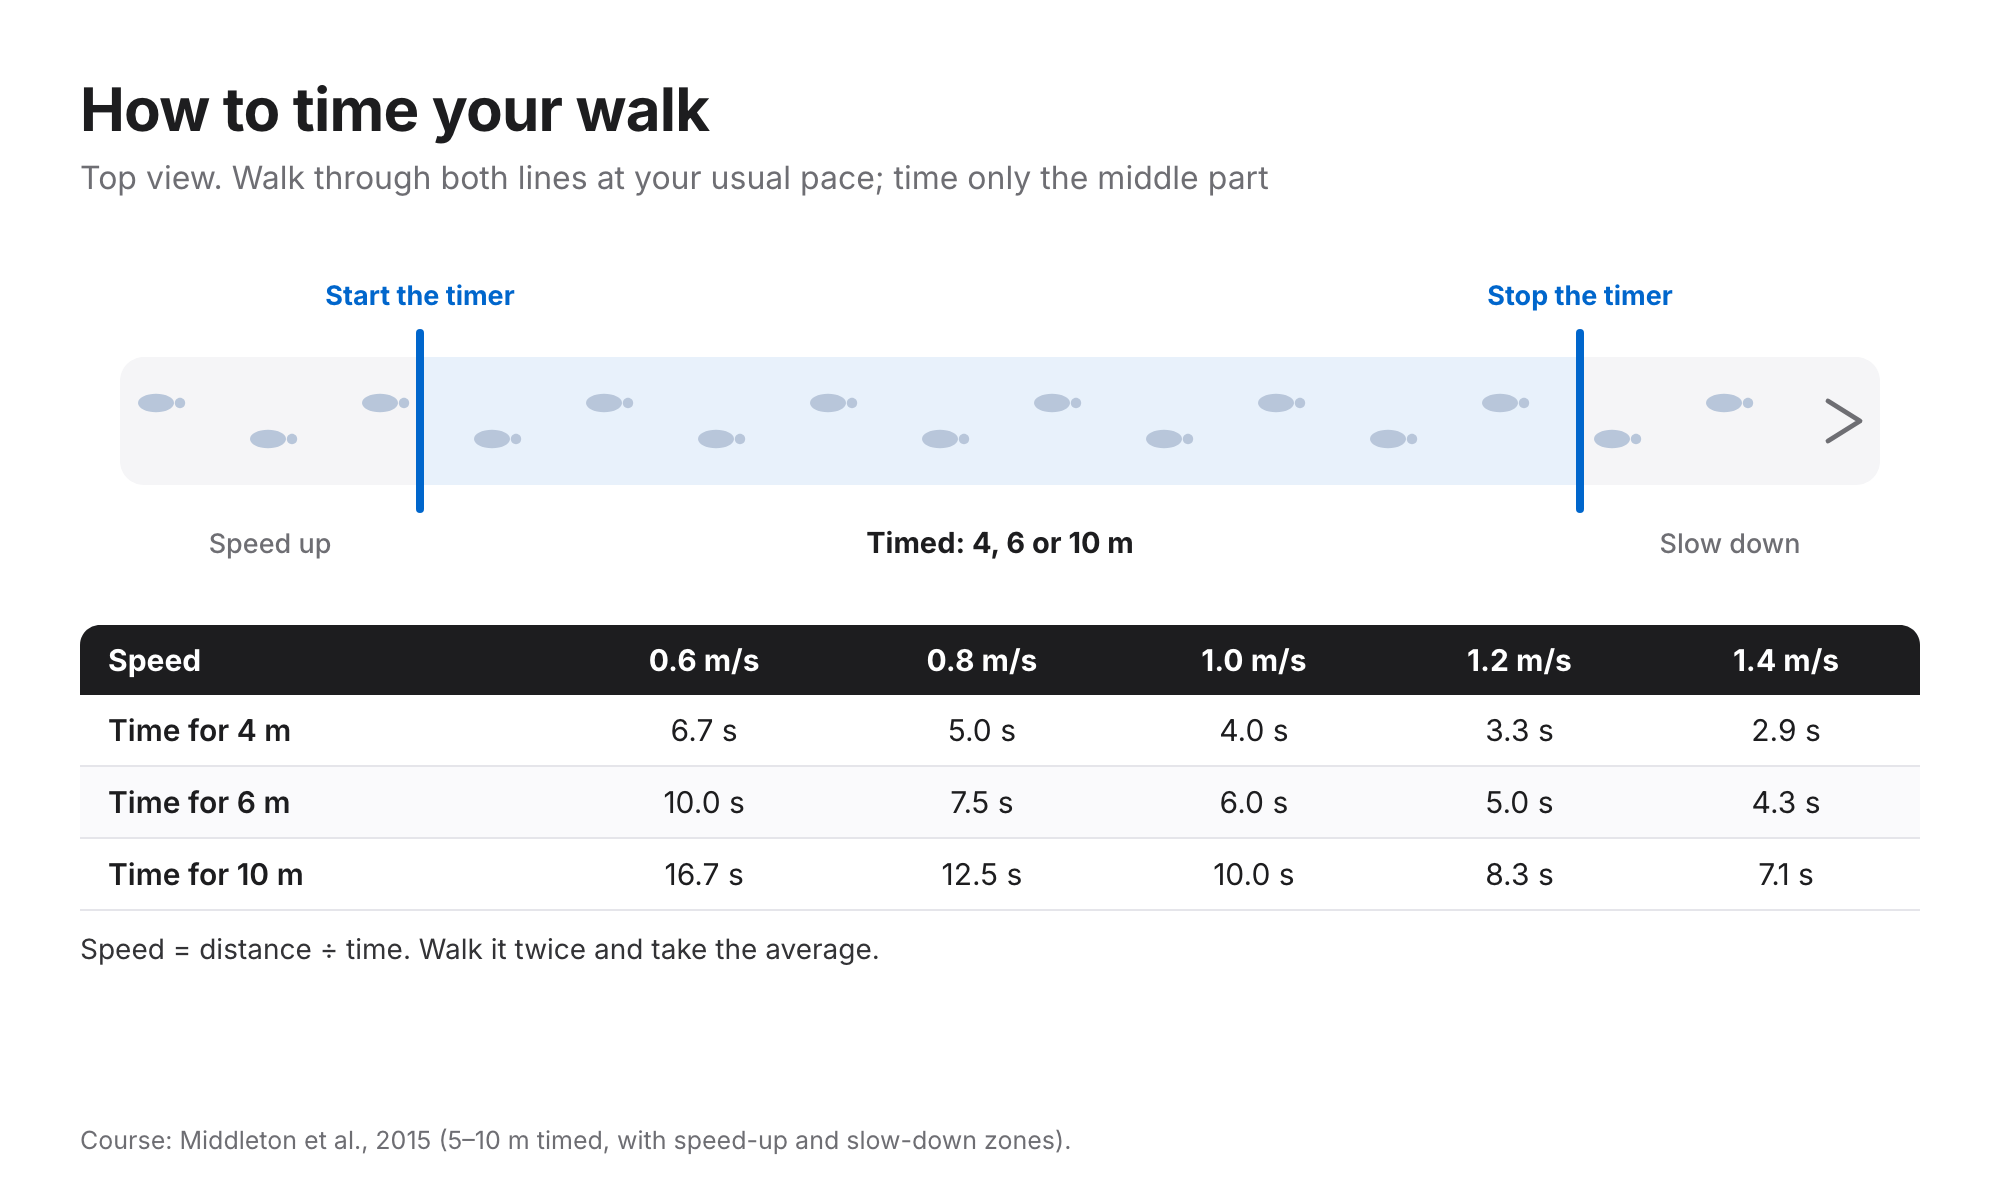
- Mark the course. Two lines 4, 6 or 10 metres apart, with about 2 metres of free floor before the first line and after the second. Reviews recommend timing 5–10 m, with speed-up and slow-down zones outside the timed part (Middleton et al., 2015). If space is tight, 4 m works.
- Walk at your usual pace, in everyday shoes and with any walking aid you normally use. Start before the first line so you're already moving at full pace.
- Time from the first line to the second. Start when the first foot crosses the first line, stop when the first foot crosses the second.
- Divide distance by time. 6 m in 5.0 s is 1.2 m/s. Walk it twice and average the two.
A walk from a standstill reads a little slower than one with a run-up. The survival cut-offs above came from standing starts over 8 feet to 6 metres, so a reading with a run-up may sit slightly above them. That matters most near a cut-off. The simple rule: keep the same course, shoes and start every time you test. For phone-based options, see how to do a gait analysis at home.
Converting m/s, km/h and mph
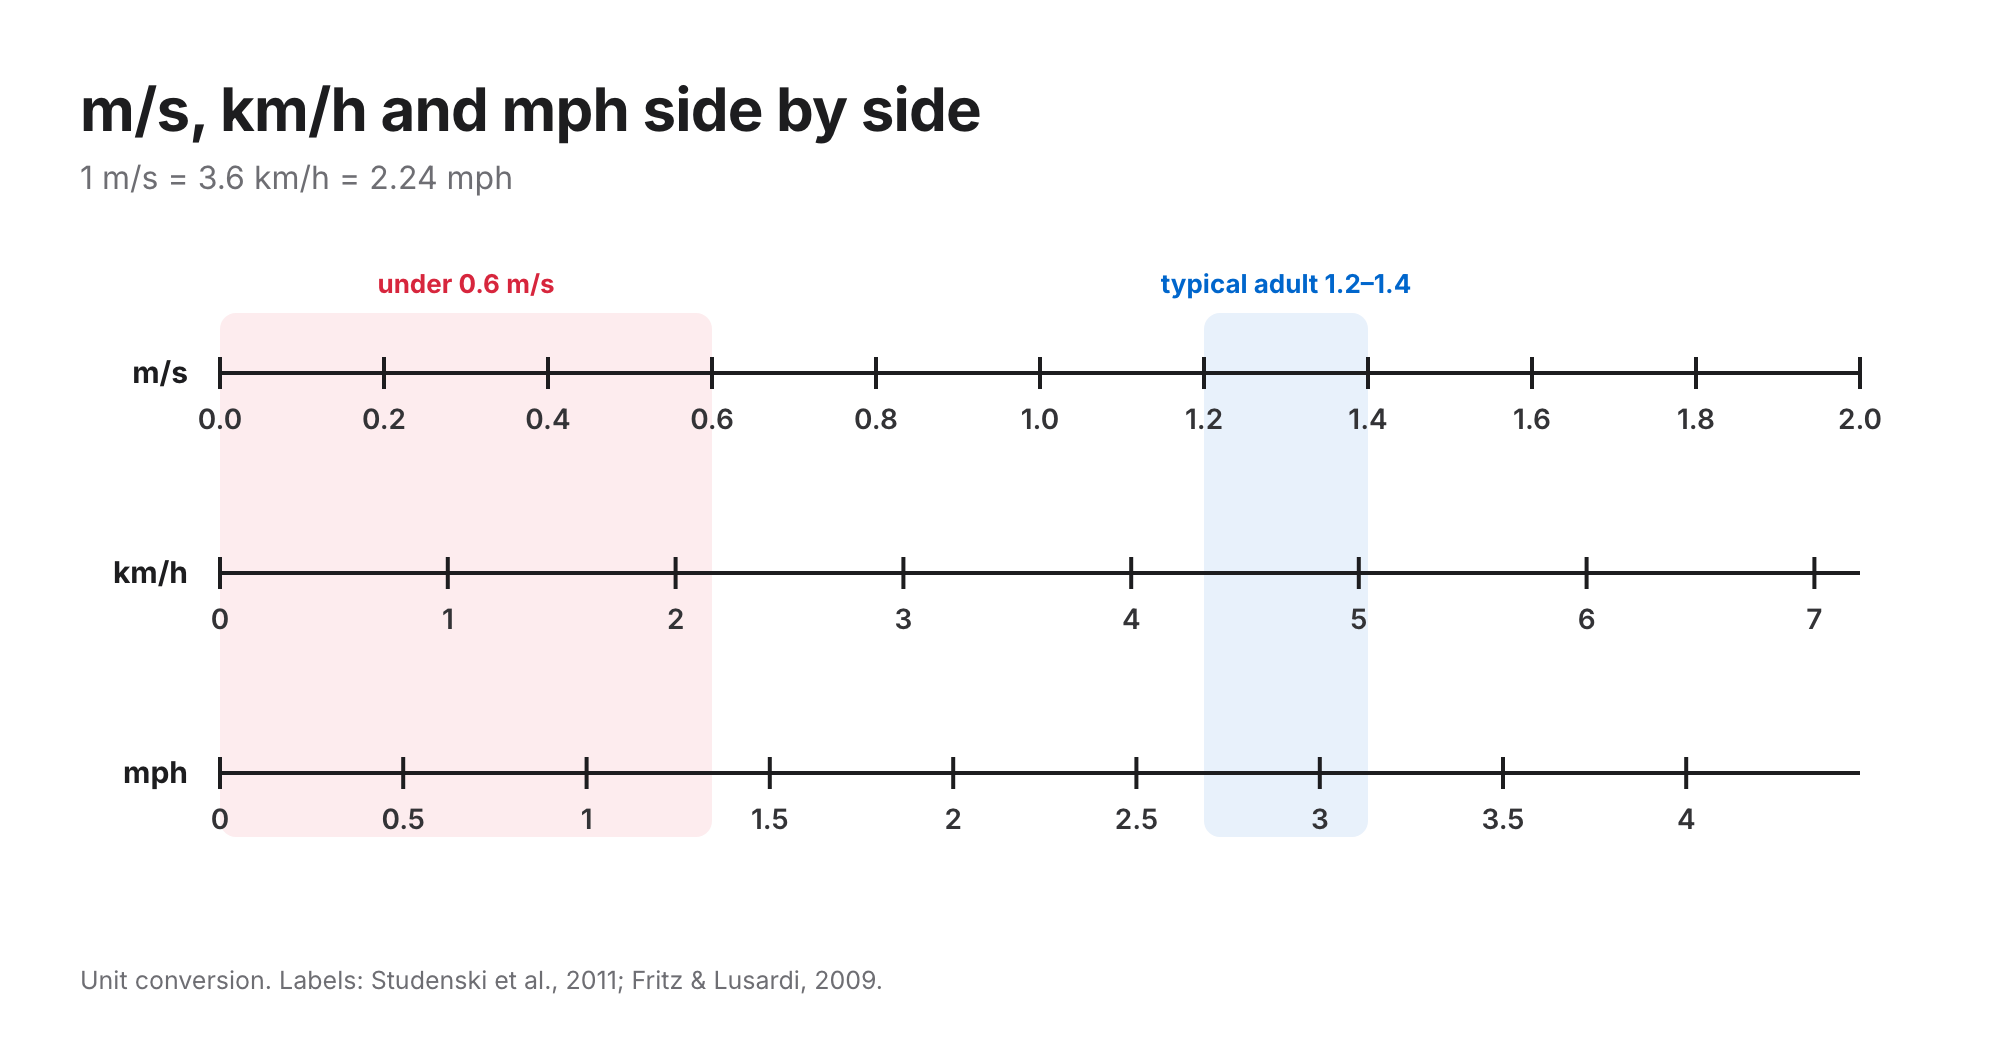
Multiply m/s by 3.6 for km/h, or by 2.24 for mph. To go back, divide km/h by 3.6 or mph by 2.24. Treadmills and fitness watches usually show km/h or mph; studies and clinicians almost always use m/s. A treadmill pace also isn't the same as walking across a room, so compare like with like.
Comfortable vs fast walking speed
All the numbers above are usual, comfortable pace. Fast walking is a different test. In 230 healthy adults aged 20–79 timed over 7.62 m, average comfortable speed ranged from 1.27 to 1.46 m/s, while maximum speed ranged from 1.75 m/s (women in their seventies) to 2.53 m/s (men in their twenties) (Bohannon, 1997). Fast speed shows reserve, the extra you have for a crossing light or a bus: one review notes that safely crossing a street in the US takes about 1.32 m/s (Middleton et al., 2015). Never mix the two when comparing results.
How much change matters
In older adults, a change of about 0.05 m/s is a small but meaningful change and about 0.10 m/s is a substantial one (Perera et al., 2006). The authors found both sizes detectable in clinical use, but only if the test is done the same way each time, so average two walks and keep the setup identical. A drop of 0.1 m/s over a few months is worth mentioning to a doctor, even if you're still above the cut-offs.
What affects walking speed
- Age and sex: speed is stable until about 60, then falls, faster after 80; women average slightly slower than men.
- Height and leg strength: taller people and those with stronger hip and knee muscles walk faster (Bohannon, 1997). Strength is the part you can train.
- Health: balance, leg strength, fitness, the sense of where your feet are, and eyesight all feed into walking speed (Middleton et al., 2015), so heart and lung disease, joint pain or nerve problems can slow it. A drop you can't explain is worth checking.
- The test itself: distance, standing vs moving start, a turn, shoes, a walking aid, the floor and how you're asked to walk all change the number.
Questions
What is the average walking speed? About 1.2–1.4 m/s for adults at their usual pace, which is 4.3–5.0 km/h or 2.7–3.1 mph. It's highest from the thirties to fifties and lower after 60.
What is a normal walking speed for a 70-year-old? Healthy adults aged 70–79 average 1.26 m/s for men and 1.13 m/s for women (Bohannon & Williams Andrews, 2011). In older adults, 1.0 m/s or more goes with longer than expected survival.
What walking speed is too slow? In adults over 65, under 0.6 m/s makes poor health and function more likely, and about 0.8 m/s marks median life expectancy for age and sex. Sarcopenia guidelines use 0.8 m/s (Europe) or 1.0 m/s over 6 m (Asia).
How do I convert walking speed from m/s to km/h or mph? Multiply m/s by 3.6 for km/h, or by 2.24 for mph. 1.0 m/s is 3.6 km/h or 2.24 mph.
How much change in walking speed is meaningful? About 0.05 m/s is a small meaningful change and about 0.1 m/s is substantial in older adults (Perera et al., 2006).
Step Doctor measures walking speed, step length and cadence from a phone video, so you can repeat the same walk every few months and see the trend in a PDF report. Read more about gait analysis in Step Doctor or the walking speed numbers in brief, or get it on the App Store or Google Play.
Step Doctor supports screening and monitoring. It doesn't diagnose, and results should inform, not replace, the judgement of a healthcare professional.