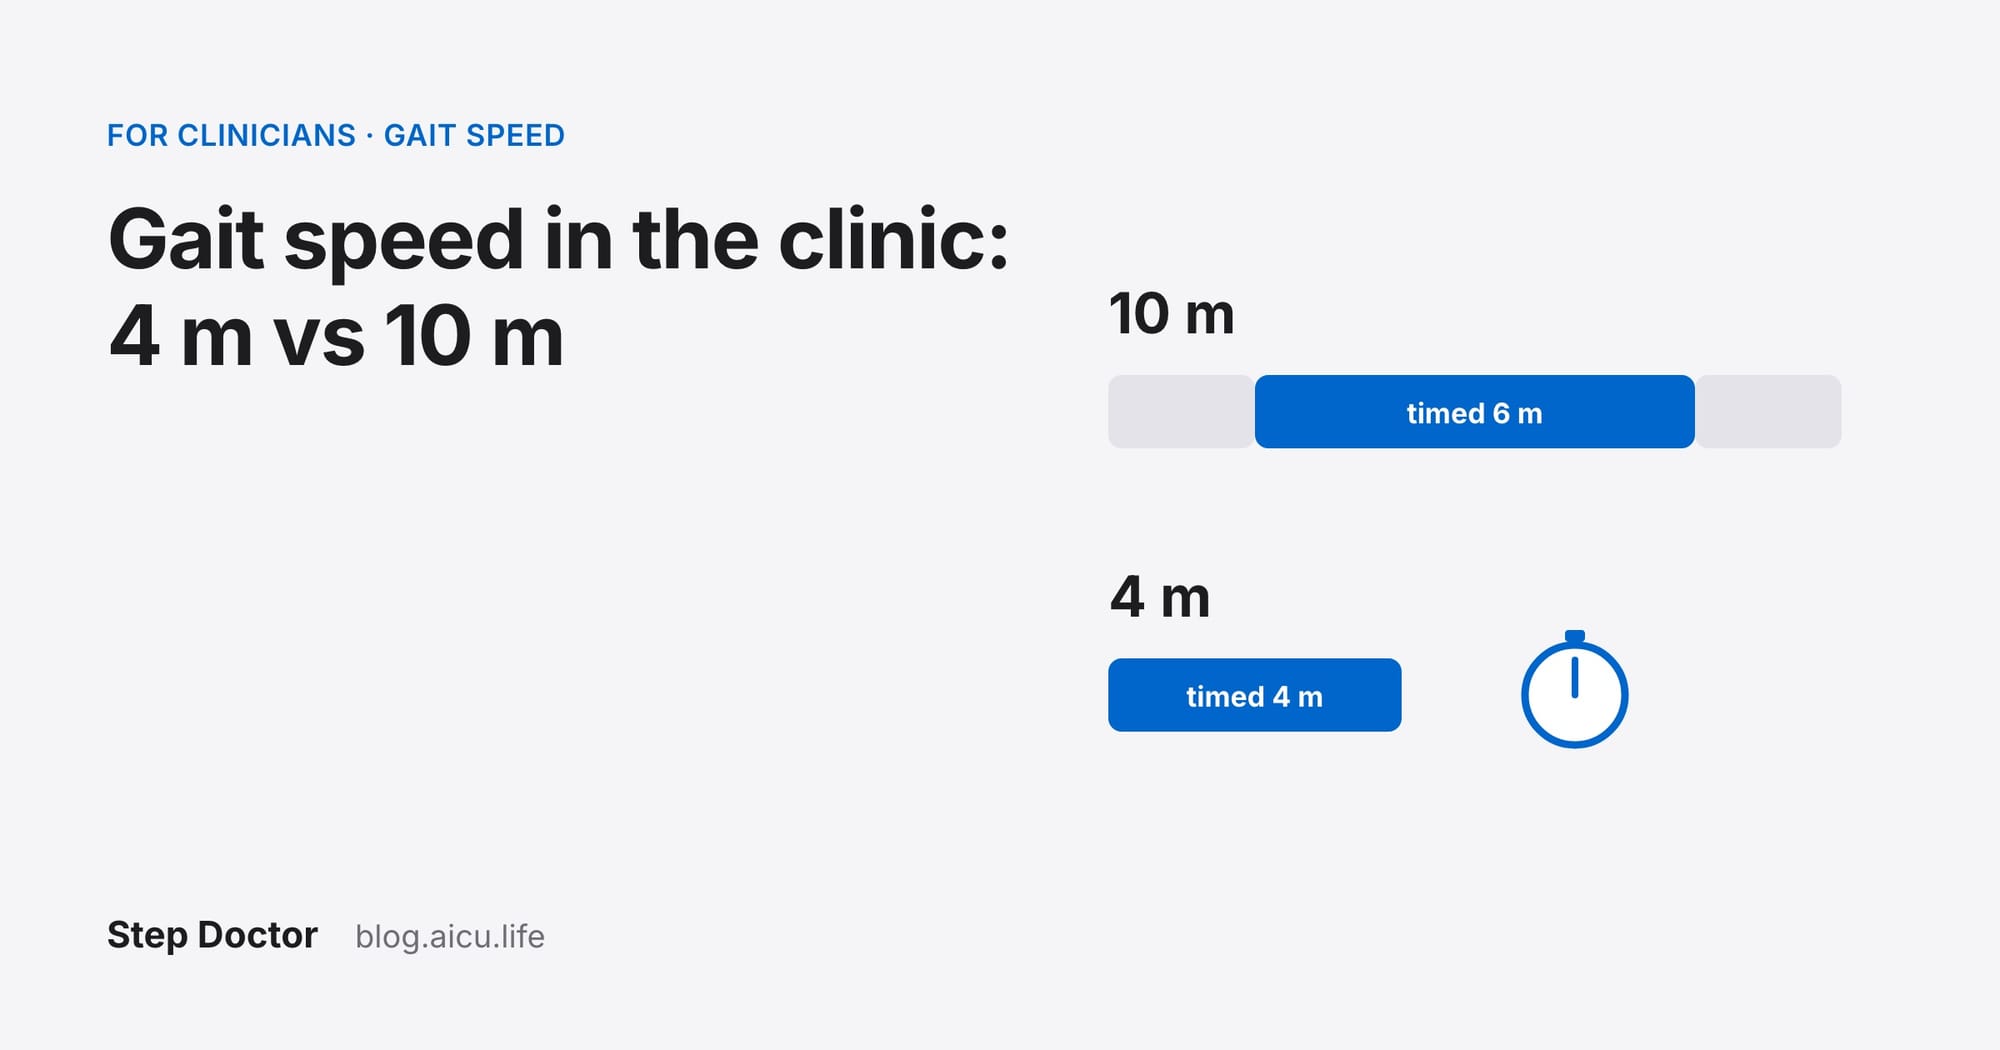
Gait speed is the simplest timed walk there is, and one of the easiest to get subtly wrong. A 4-metre walk from a standstill and a 10-metre walk with a run-up both give an answer in metres per second, but not the same answer: in the same older adults, the protocol alone moved usual gait speed by about 0.1 m/s, which is the size of a substantial change. This guide covers the two common clinic protocols, usual versus fast pace, static versus dynamic starts, how course length changes the result, the thresholds used to interpret it, how much change is meaningful, and how to document it so the next test is comparable.
Two common protocols
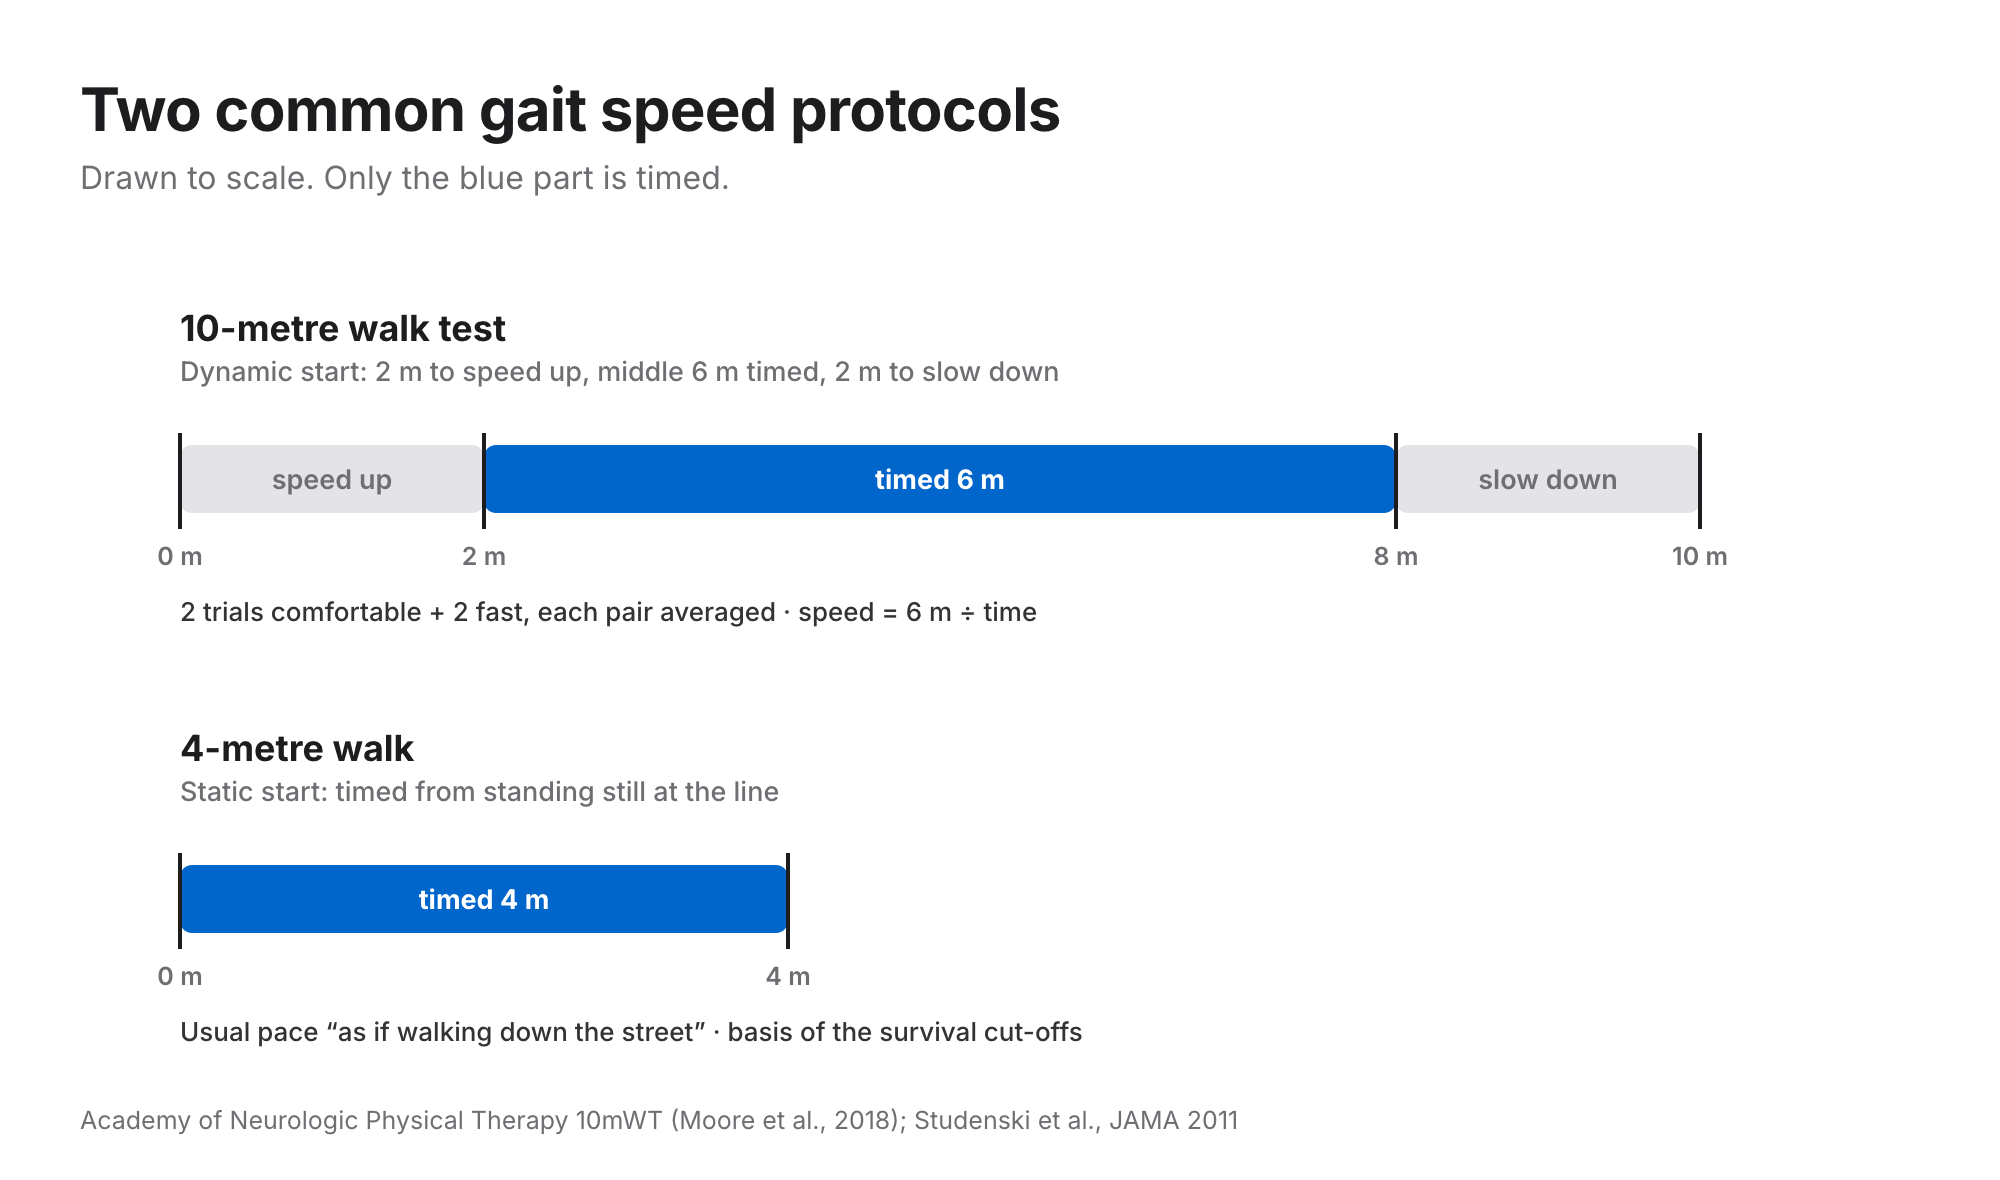
The 10-metre walk test (10MWT), as recommended in the core outcome set for adults with neurologic conditions (Academy of Neurologic Physical Therapy; Moore et al., 2018):
- A clear, straight 10 m path on solid flooring, with marks at 0, 2, 8 and 10 m.
- The patient starts on the 0 m line. Only the middle 6 m is timed, so the first 2 m are for speeding up and the last 2 m for slowing down.
- Start the stopwatch when any part of the leading foot crosses the 2 m mark, and stop it when any part of the leading foot crosses the 8 m mark. Record to the hundredth of a second; speed = 6 m ÷ time.
- Two trials at comfortable speed, then two at fast speed. Average each pair and document both speeds.
- Patients use their current assistive device or bracing, which must be documented. Walk at least half a step behind so you don't pace them, and neither of you should talk during the test.
The 4-metre walk from a standing start is the form behind the best-known survival data. In the pooled cohorts of Studenski et al. (2011), all studies used a usual pace and a standing start over 8 feet to 6 metres, converted to 4-metre gait speed, and the authors suggest it for practice: from a standing start, walk at your usual pace "as if you were walking down the street", with no further encouragement. It needs only 4 m of floor, which makes it practical in a small room or at home.
Usual versus fast pace
These are two different tests. The 10MWT instructions are:
- Comfortable: "Walk at your own comfortable walking pace and stop when you reach the far mark."
- Fast: "Walk as fast as you can safely walk and stop when you reach the far mark."
In 230 healthy adults aged 20–79 timed over 7.62 m, average comfortable speed ranged from 1.27 to 1.46 m/s, and average maximum speed from 1.75 m/s (women in their seventies) to 2.53 m/s (men in their twenties) (Bohannon, 1997). Usual pace is what most cut-offs refer to. Fast pace shows reserve: in the US, safely crossing a street takes about 1.32 m/s (Middleton et al., 2015). The same review notes that in chronic stroke, adding a real-life example ("reach a bus that is about to pull out") or a demonstration gave higher maximal speeds than a plain instruction, so keep the fast-pace wording fixed too.
Static versus dynamic start
In a static start, timing begins with the patient standing still at the line. In a dynamic (flying) start, they begin walking before the timed section, so the clock only sees steady walking. A review of walking speed testing summarised it this way (Middleton et al., 2015):
- Static starts give slower speeds than dynamic starts, and leaving out the acceleration phase may add variability that makes true change harder to detect.
- Recommended acceleration distances for older adults range from 2.17 m (healthy) to 2.5 m (frail) at usual pace. Maximal pace needs more: 3.23 m in healthy older adults.
- A straight path is better than one with a turn (for example 10 m rather than 5 m × 2).
How course length and start change the result
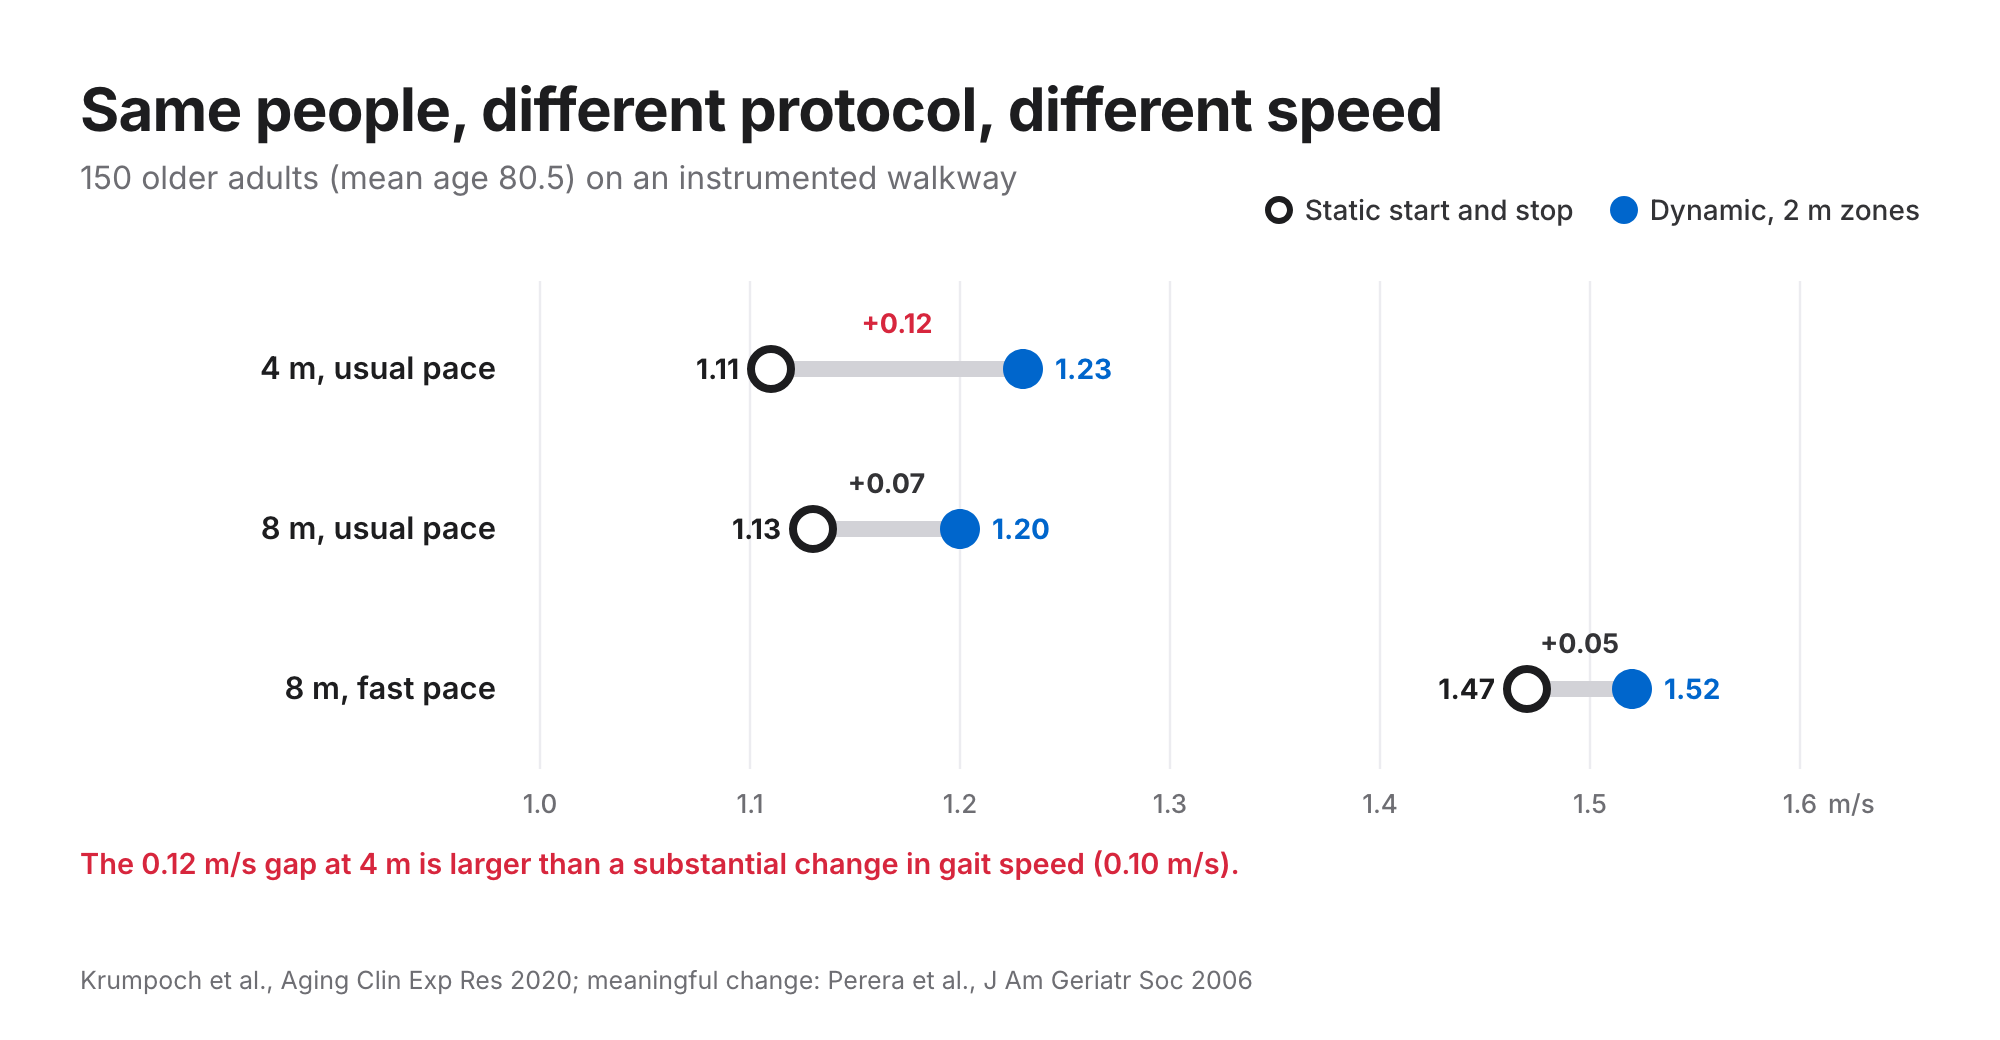
The clearest comparison comes from 150 community-dwelling older adults (mean age 80.5) who walked every combination on an instrumented walkway, with 2 m acceleration and deceleration zones for the dynamic walks (Krumpoch et al., 2020):
| Usual pace | Static start and stop | Dynamic (2 m zones) | Difference |
|---|---|---|---|
| 4 m | 1.11 m/s | 1.23 m/s | 0.12 m/s |
| 8 m | 1.13 m/s | 1.20 m/s | 0.07 m/s |
Speed was faster when the protocol had no static start or stop, and the difference was larger over the shorter distance. Distance on its own made no significant difference to usual speed; it was the combination of a short course and a static start that pulled the number down. A 4 m dynamic walk and an 8 m static walk differed by 0.10 m/s.
A second study timed 43 healthy adults (mean age 84.3) over 4 m and 10 m at their self-selected speed. Both tests were highly reliable on their own (ICC 0.96–0.98), but the two disagreed by up to about ±0.15–0.17 m/s, so the authors concluded they can't be used interchangeably (Peters et al., 2013). The practical rule from the review: a 4 m result can be compared with other 4 m results, not with a 10 m result. Where space allows, it suggests timing 5 to 10 metres.
Interpretation thresholds
| Threshold | Meaning | Protocol behind it | Source |
|---|---|---|---|
| < 0.6 m/s | Poor health and function more likely | Usual pace, standing start, expressed as 4 m speed | Studenski et al., 2011 |
| ≈ 0.8 m/s | Predicted life expectancy at the median for age and sex | Same | Studenski et al., 2011 |
| ≥ 1.0 m/s | Better than average life expectancy suggested | Same | Studenski et al., 2011 |
| ≤ 0.8 m/s | Low physical performance, an indicator of severe sarcopenia (European definition, EWGSOP2) | 4 m usual walking speed test | Cruz-Jentoft et al., 2019 |
| < 1.0 m/s | Low physical performance (Asian sarcopenia definition, AWGS 2019) | 6 m walk | Chen et al., 2020 |
| ≈ 1.32 m/s | Needed to cross a US street safely | Reserve, fast pace is more relevant | Middleton et al., 2015 |
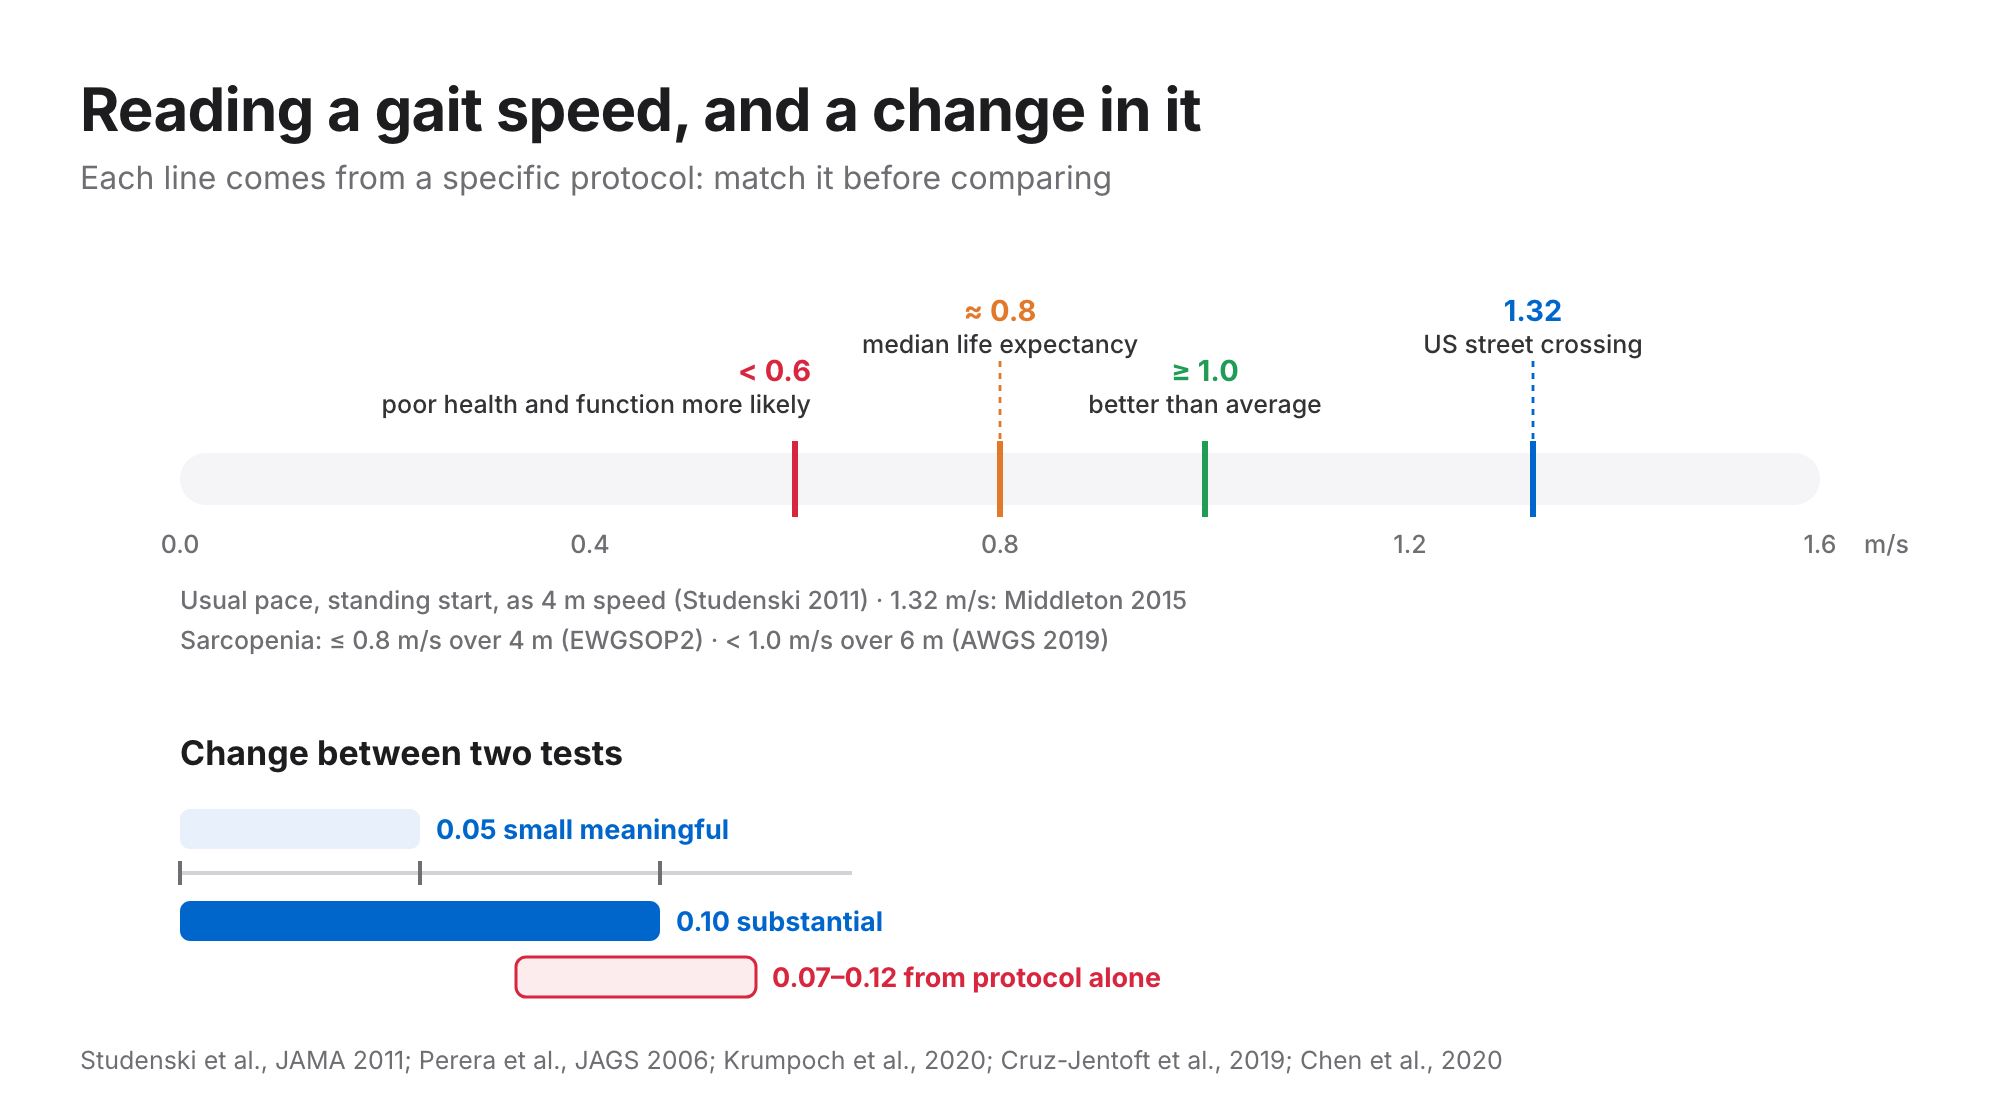
Two cautions. First, Studenski and colleagues found that survival rose across the whole range of gait speeds (hazard ratio 0.88 per 0.1 m/s faster); the cut points are aids to interpretation, not steps. Second, the protocol matters most near a threshold: a dynamic 10 m result of 0.82 m/s may read below 0.8 m/s from a 4 m standing start. For age norms in healthy adults, see average walking speed by age.
How much change is meaningful
In older adults, small meaningful change is near 0.05 m/s and substantial change near 0.10 m/s, from community-dwelling older people, people with mobility limitations and subacute stroke survivors (Perera et al., 2006). The authors found that both sizes are detectable in clinical use. Put next to the protocol effects above (0.07–0.12 m/s), the lesson is plain: a change of protocol between visits can look like a meaningful change in the patient. Same course, same start, same instruction, same number of trials.
How to document it
- Protocol: 10MWT or 4 m, static or dynamic, length of acceleration and deceleration zones
- Pace instruction (usual or fast) and number of trials averaged
- Assistive device, bracing and level of assistance
- Speed in m/s for each pace, and the threshold you compared it with
- Change since last time, against 0.05 and 0.10 m/s
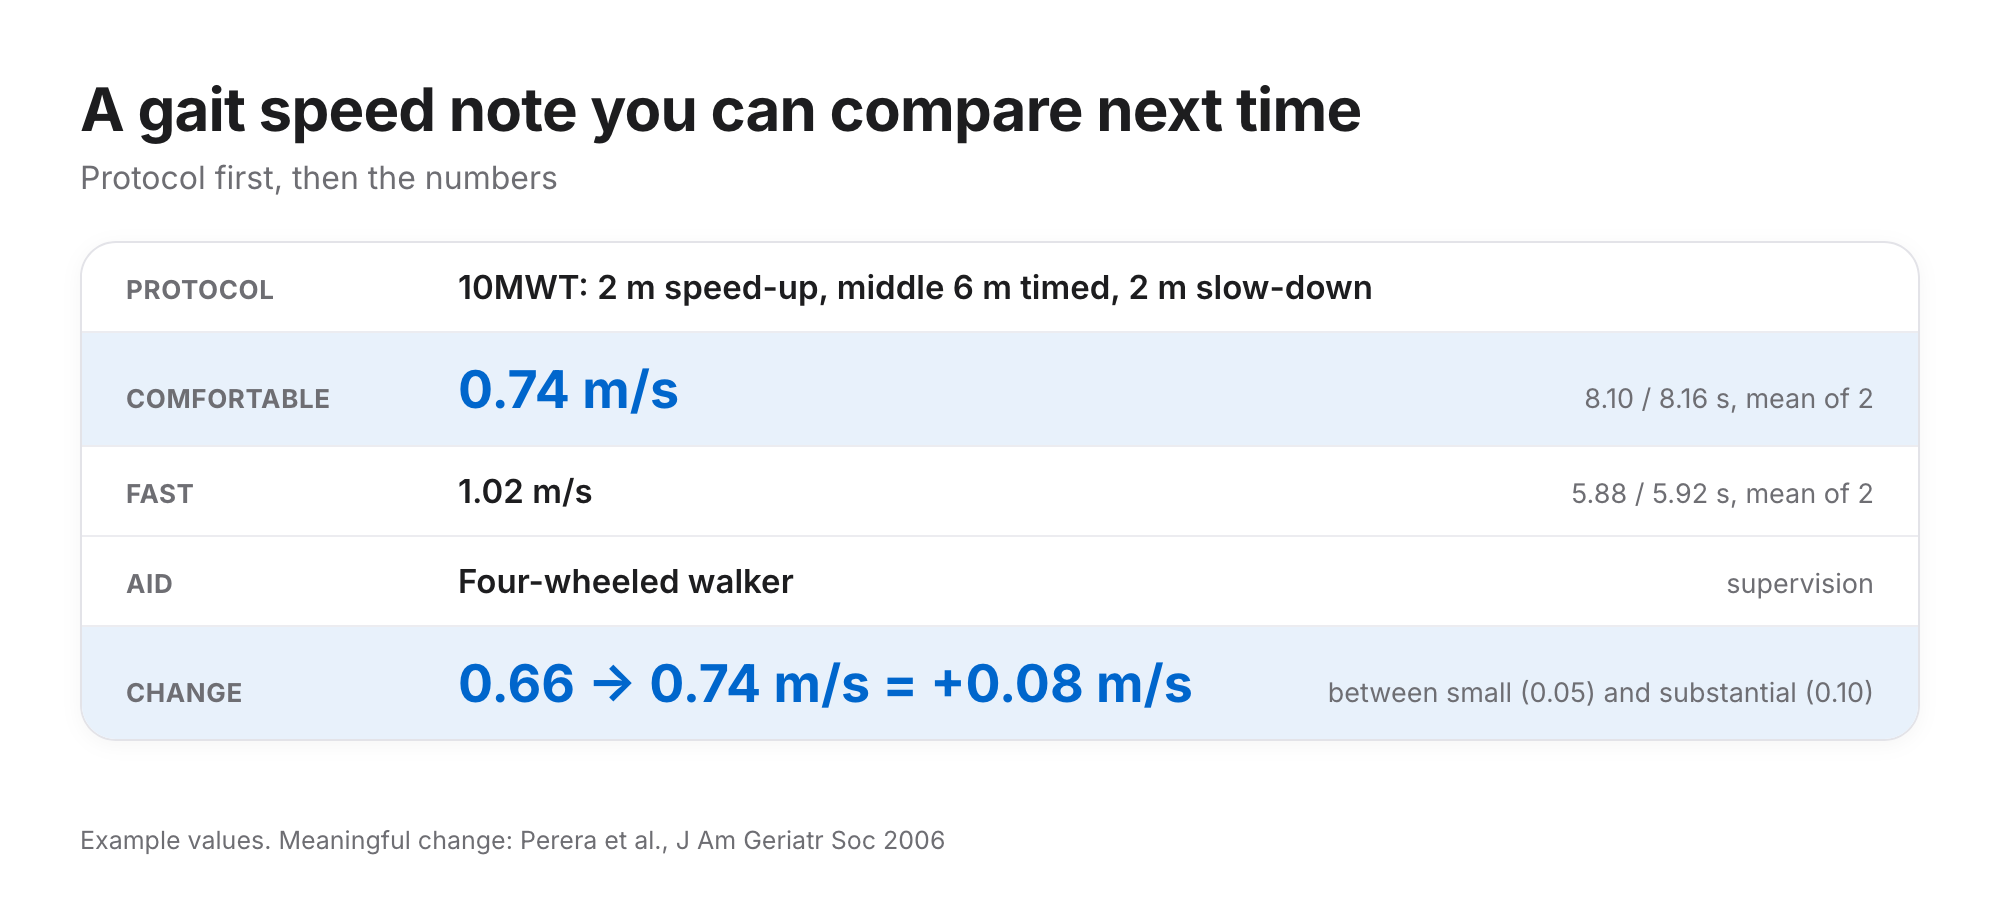
A sample line:
10MWT (2 m acceleration, middle 6 m timed, 2 m deceleration). Comfortable 0.74 m/s (8.10 / 8.16 s, mean of 2); fast 1.02 m/s (5.88 / 5.92 s). Four-wheeled walker, supervision. Previous comfortable 0.66 m/s on 5 Oct: +0.08 m/s, between small (0.05) and substantial (0.10) meaningful change (Perera et al., 2006).
Questions
What is the difference between the 4-metre and 10-metre walk tests? The 10-metre walk test times the middle 6 m of a 10 m path, so the patient is already at speed; the 4-metre walk is usually timed from a standing start. Both are reliable, but their results differ and shouldn't be used interchangeably (Peters et al., 2013).
Should gait speed be measured with a static or dynamic start? Either, as long as you use the same one every time. Static starts read slower; in older adults, a 4 m static walk was 0.12 m/s slower than a 4 m walk with a 2 m run-up (Krumpoch et al., 2020). Use the start that matches the cut-off you plan to apply.
How do you calculate speed in the 10-metre walk test? Divide 6 metres by the time taken to walk the middle 6 m, from the 2 m mark to the 8 m mark. Average two trials at each pace.
What gait speed is a concern in older adults? Under 0.6 m/s makes poor health and function more likely, and about 0.8 m/s marks median life expectancy for age and sex (Studenski et al., 2011). Sarcopenia guidelines use 0.8 m/s or less (Europe) and under 1.0 m/s over 6 m (Asia).
What is the MCID for gait speed? About 0.05 m/s for a small meaningful change and 0.10 m/s for a substantial change in older adults (Perera et al., 2006).
Step Doctor measures walking speed, step length and cadence from a phone video and keeps each walk in a PDF report, so the same walk can be repeated and compared over time. Read more about gait analysis in Step Doctor, or get it on the App Store or Google Play.
Using this with patients? Request early clinic access.
Step Doctor measures and records movement tests. It doesn't diagnose, and results should inform, not replace, the judgement of a healthcare professional.