A Timed Up and Go time only means something next to the right reference. Twelve seconds is a warning sign in one group and a typical result in another, and a two-second improvement may be real progress or ordinary day-to-day variation. This guide brings together the published TUG cut-offs for different conditions, the main variants of the test, and how to tell whether a change between two tests is real.
Why one cut-off doesn't fit everyone
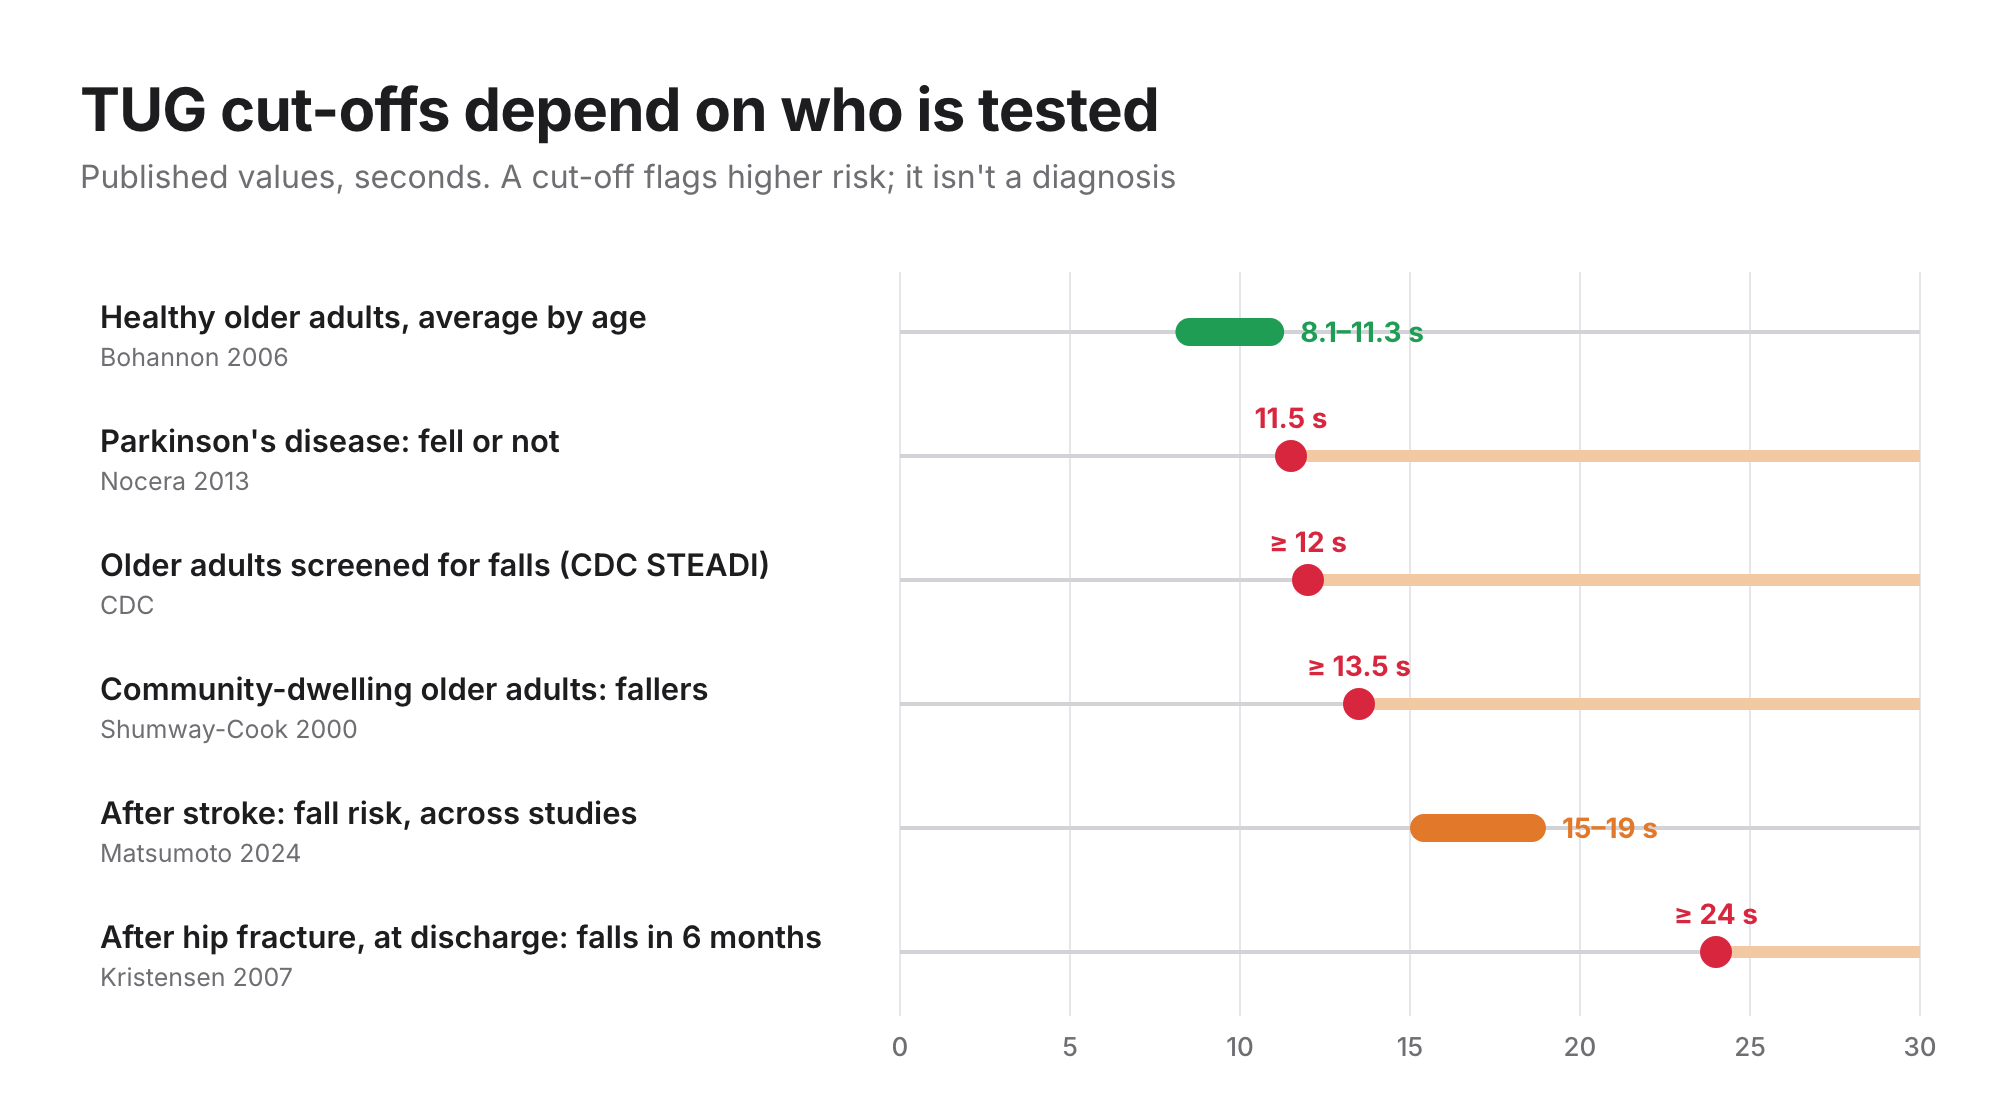
A cut-off is chosen to separate two groups in a particular study, usually people who fell from people who didn't. It depends on who was tested, how falls were counted and over what period. Use the cut-off from the study that looks most like the person in front of you, and read it as a signal of higher risk, not a diagnosis.
TUG cut-offs by condition
| Who | Time | What it showed | Source |
|---|---|---|---|
| Healthy older adults | 8.1 / 9.2 / 11.3 s | Average time at 60–69, 70–79 and 80–99 (meta-analysis) | Bohannon, 2006 |
| Older adults screened for falls | ≥ 12 s | "At risk for falling" in the CDC's STEADI program | CDC STEADI |
| Community-dwelling older adults | ≥ 13.5 s | Identified people who had fallen with 87% sensitivity and specificity, in a study of 30 | Shumway-Cook et al., 2000 |
| Parkinson's disease | 11.5 s | Proposed cut-off to separate fallers from non-fallers, from 2,097 people (sensitivity 0.66, specificity 0.62) | Nocera et al., 2013 |
| After stroke | 15–19 s | Range of cut-offs across studies; accuracy was modest (area under the curve 0.66–0.70) | Matsumoto et al., 2024 (scoping review) |
| After hip fracture, at discharge | ≥ 24 s | The only measure that predicted falls in the following 6 months (79 patients, 59 followed up) | Kristensen et al., 2007 |
One caution applies to all of them. Pooled across studies, a slow TUG makes falls more likely, but a faster time doesn't rule them out (sensitivity 31%, specificity 74%), so the TUG shouldn't be used on its own to predict falls (Barry et al., 2014).
Variants of the TUG
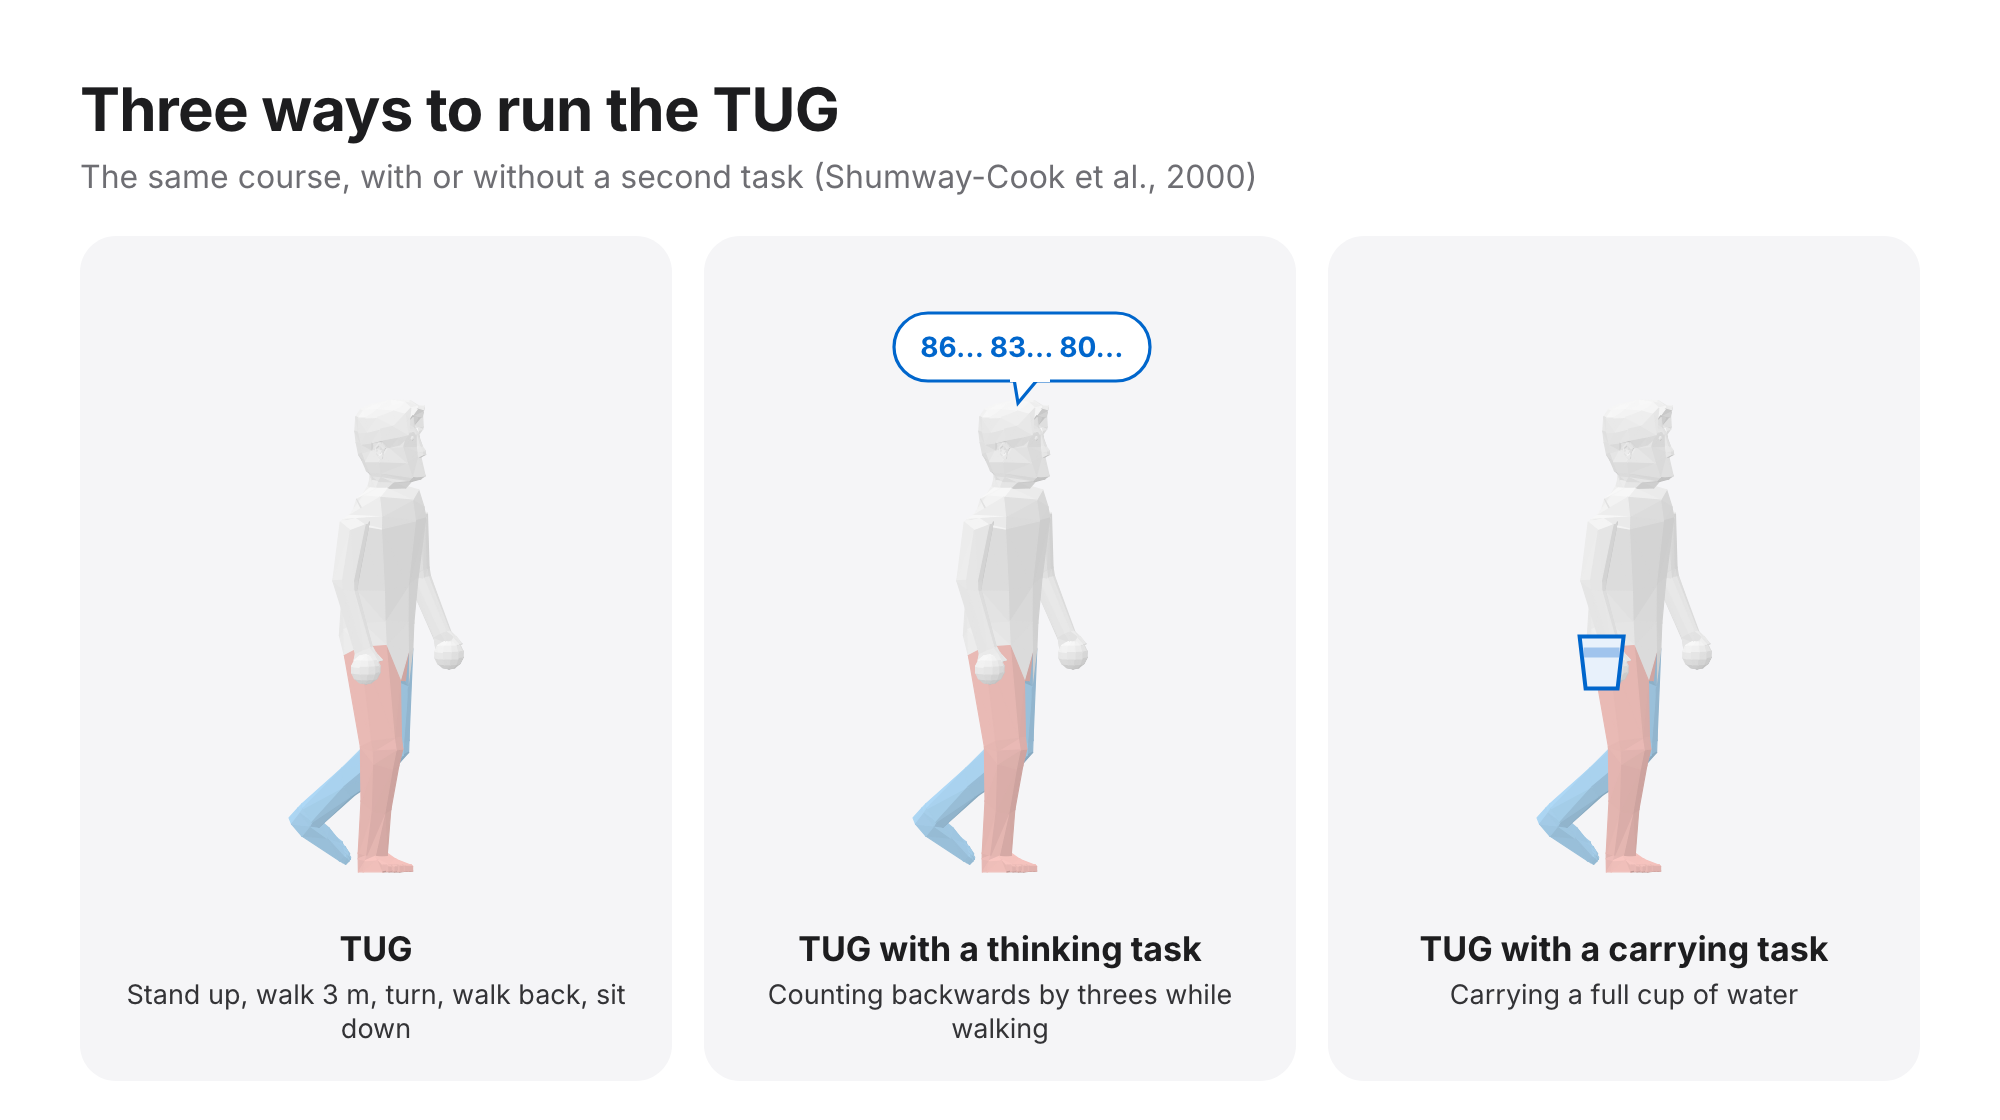
The same course can be run with a second task. In their 2000 study, Shumway-Cook and colleagues timed older adults on the standard TUG, on the TUG while counting backwards by threes, and on the TUG while carrying a full cup of water. Everyday walking often comes with a second task, and a test that adds one can show difficulties the plain TUG misses.
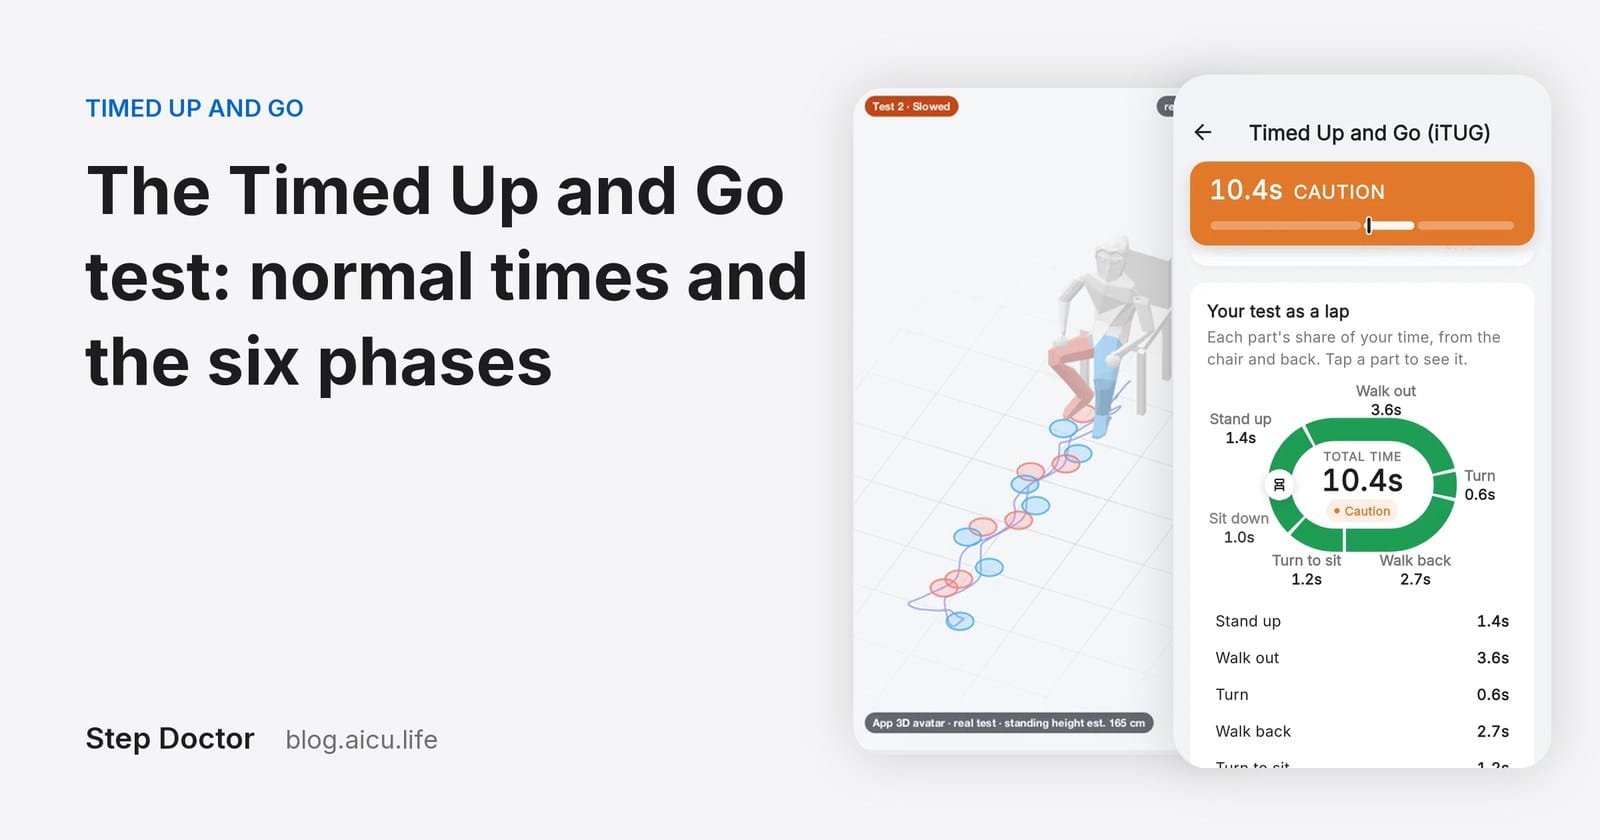
The instrumented TUG (iTUG) keeps the standard test and adds the time of each part: standing up, walking out, turning, walking back, turning to sit and sitting down. Older adults without cognitive impairment have published reference values for each part (Mirelman et al., 2014), and in that study, people with mild cognitive impairment were slower in the transition from turning to walking.
Is a change between two tests real?
Two TUG times are never exactly the same, even on the same day. The minimal detectable change is the smallest difference that's larger than this normal variation. In people with Parkinson's disease it was 3.5 seconds (72 people; Huang et al., 2011). A change smaller than that may be noise; a larger one is likely real.
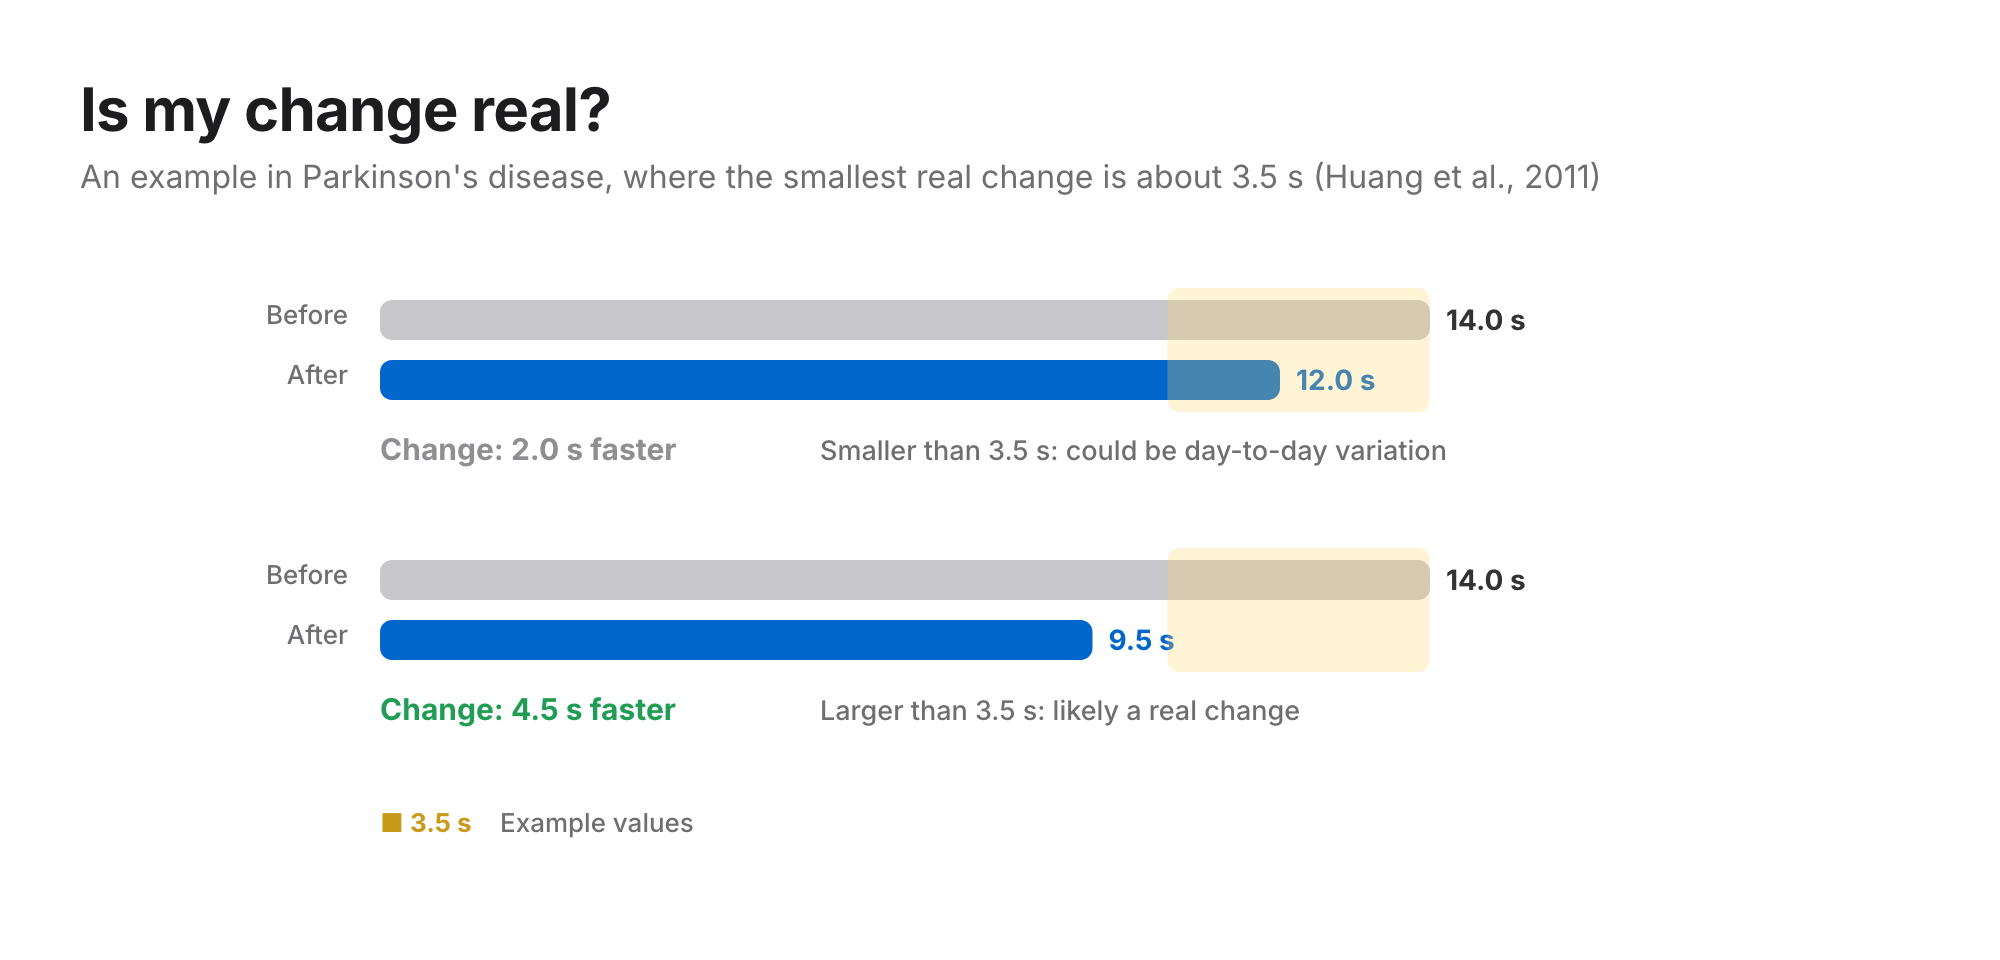
The value depends on the population, so use one measured in people like the ones you test, and keep everything else the same: chair, course, shoes, walking aid, time of day and instructions.
Putting it together
- Compare with the age norms to see whether a time is slower than average.
- Check the cut-off for the person's condition, and treat a time above it as a reason to look closer, not as a diagnosis.
- Look at the parts if you can: a slow rise, walk or turn points to different things.
- Repeat the test the same way and judge change against the minimal detectable change.
A printable TUG score sheet with these values is free to download, and every value is also on our reference values page.
Questions
What is a normal TUG time? Healthy older adults average 8.1 seconds at 60–69, 9.2 at 70–79 and 11.3 at 80–99 (Bohannon, 2006).
What TUG time indicates fall risk in Parkinson's disease? 11.5 seconds was the proposed cut-off for separating fallers from non-fallers in a study of 2,097 people (Nocera et al., 2013), with moderate accuracy.
What is the TUG cut-off after hip fracture? At discharge, 24 seconds or more predicted falls in the following six months (Kristensen et al., 2007).
How much does a TUG time have to change to be real? It depends on the population. In Parkinson's disease, the minimal detectable change was 3.5 seconds (Huang et al., 2011).
Step Doctor times the TUG and its six phases hands-free from a phone video. Read more about the Timed Up and Go in Step Doctor, or get it on the App Store or Google Play.
Step Doctor supports screening and monitoring. It doesn't diagnose, and results should inform, not replace, the judgement of a healthcare professional.